
-
Using Microsoft IE Developer Toolbar
2008-12-17 16:33:35
Introduction
Say goodbye to Microsoft Explorer's View Source, well almost. For those of us who do a lot of web development there has always been a need for a tool to examine the structure of documents we're working on; introducing Microsoft IE Developer Toolbar. The IE Developer Toolbar allows web developers to examine and change website's CSS, HTML, DOM, and Javascrīpt. Firefox web browser has enjoyed an excellent add-on, named Firebug, that provided this kind of functionality for some time now. This article, however, is not meant as a comparison between the two products. You may check Firebug if you're interested. Also, check out Firebug Lite for ways to integrate Firebug with Internet Explorer.
Installing IE Developer Toolbar
- Download the IE Developer Toolbar and run the installer.
- Close an re-open the Internet Explorer.
- Add the IE Developer Toolbar button to your toolbar
- Then close the window
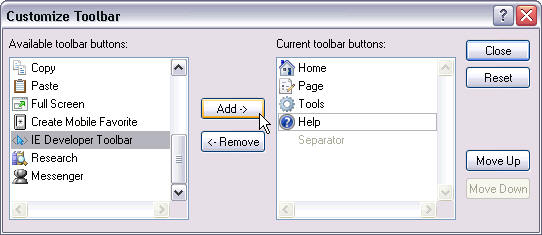
- The IE Developer Toolbar button will appear in your toolbar for easy access.

Starting with the IE Developer Toolbar
Clicking the IE Developer Toolbar button you just added to your toolbar reveals the add-on. By default it is pinned to the bottom of the Internet Explorer window, but you may un-pin it by clicking the button located in the right upper corner of the tool. Note that whenever you pin or unpin the add-on the selected context is lost and you will need to re-select the element you were examining.
As you may see from the figure above IE Developer Toolbar comes with a number of options that enable you to examine your HTML document. To access it's functionality use the little toolbar and the menus.
Working With Documents
Perhaps the feature you may find yourself using the most is "Select Element by Click" available from the Find menu or the little toolbar button

What is particularly interesting about this view is that the exposed structure below is the actual HTML as defined in the source file PLUS any Javascrīpt generated DOM elements. Meaning, that by simply using View Source you don't actually see any HTML elements generated with, for example, document.createElement method, but in IE Developer Toolbar you do.
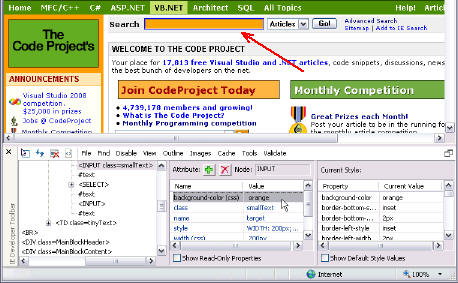
After clicking the "Select Element by Click" button the document's structure is shown in the tree view with the element you click-selected:
The above example comes from selecting the Search button of the Code Project home page. All of the selected item's pre-set attributes are shown along with their current values. Double-click a value in the grid to modify it. In addition, you may add attributes and their values to try them out. For example, with the above selection still active click the plus icon
 .
.
You should see the following:
Choose the background-color from the combo box, then type "orange" in the value column then hit the enter key. Notice that the search input box turns orange.
For ways, other than "Select Element by Click", to locate elements select Find >> Find Element... menu. The following dialog box appears:
As you may see you can search for elements using a variety of options.
Shortcuts
Right-click a node in the tree-view to get the following options:

These options allow you to view source of selected element with or without a style that it uses. This is a great improvement over having to search for an element's source code in the whole document hierarchy, Choosing Element Source, for example, produces the following for this selection:
Another interesting shortcut may be found in the Current Style list. Right click the style element you'd like to trace and choose the Trace Style context menu.
For this example the following shows up:
Clearly this makes locating the actual applied style quite simple. This may be particularly useful when dealing with multiple style-sheets and in-line style blocks that may override each other making it very difficult to determine which one is actually in effect.
Tools Menu
This tool may be of particular interest to UI designers. It features a resize option to preview screen at different browser resolutions, e.g. 800x600, 1024x768, etc. A more interesting features, however, are the Show Ruler and the Color Picker:
Show Ruler
This window allows you to draw rulers over any screen element to see it's dimensions.. You may click the black, red, or green box to show rulers of that color, or white to show none. For example:
Color Picker
you may avoid a great deal of mining through the code and style sheets before you find the color used. This tool makes it a snap.
Other Menus
Other menus are pretty self explanatory, use them to locate elements within the document or adjust Microsoft Explorer's behavīor.
- Disable - disables or enables scrīpts, pop-up blocker, and CSS
- View - enables you to quickly see element details on screen using labels. Especially check out the View >> Source options.
- Outline - similar to the View above, except it draws boxes around the elements it shows. Especially check the Outline >> Any Element... this option allows you to specify multiple search criteria for the elements you are trying to outline. Also, notice the Outlines >> Clear Outlines option, very handy when you specified a bunch of options.
- Images - similar to View and Outline but specifically deals with images. Check out the Images >> View Image Report.
- Cache - deals with the way the web browser processes cookies and the file cache.
- Validator - provide page validation using w3.org and other online tools. Checks for valid HTML, CSS, accessibility, etc.
Note
Some users reported problems with the Internet Explorer 7.0 following the IE Developer Toolbar reinstallation. Should you experience these problems, depending on your installation and a number of variables, you may find the following useful: IE Dev Toolbar 1.00.2188.0 annoying popup fix
Conclusion
While not a very mature tool, IE Developer Toolbar provides some useful functionality for examining and tweaking of web pages. Especially useful is the ability to locate elements through point and click. If you are a web developer dealing with the Internet Explorer, IE Developer Toolbar may make a great addition to your development toolbox.
标题搜索
我的存档
数据统计
- 访问量: 6555
- 日志数: 13
- 建立时间: 2007-08-09
- 更新时间: 2009-01-06
