

性能测试报告
测试环境
CPU 4core AMD Opteron 62xx class
MemTotal: 8061436 kB
nginx version: openresty/1.11.2.5
redis-cli 4.0.2
业务背景
redis数据结构
(1)hash: [key]_mac: 已本地激活的号码,field为mac,value为 icntv_id [key]_icntv_id: 已本地激活和尚未激活的号码,field为icntv_id,value为 mac:timestamp,尚未绑定的时候value为-1 (2)list: [key]_pool:记录该[key]池中尚未使用的号码,测试前已经写入了10万条数据 [key]_activation: value为[icntv_id:mac:timestamp]值的长串,pop后进入MQ |
需测试接口
1./auth 验证接口,验证号码和绑定是否一致 2./activate 绑定接口,传入mac绑定对应的号码 |
测试工具以及方法
ab
apache所出http的benchmark工具,通过调整并发数测试不同并发下的接口表现情况,但无法调整post的body内容,测试脚本如下:
ab -n 20000 -c 50 -k -T application/json -p post.txt http://xxx.xxx.xxx.xxx:8080/auth >> ab.log
-c 并发数
wrk
一个开源http的benchmark工具,与ab不同的是支持lua脚本修改每次提交内容,测试脚本如下:
wrk -t1 -c600 -d10s -s scripts/mac_add.lua http://xxx.xxx.xxx.xxx:8080/auth >> wrk.log
涉及lua脚本如下:
counta = 190001 request = function() counta = counta + 1 wrk.headers["Content-Type"] = "application/json" wrk.body = '{"mac":"'..counta..'"}' wrk.method = "POST" return wrk.format() end |
openresty的systemtap工具和FlameGraph工具
生成火焰图的工具,分析lua程序的性能瓶颈.生成脚本如下,-p为master nginx的进程号:
openresty-systemtap-toolkit-master/ngx-sample-lua-bt -p 16518 --luajit20 -t 5 > wrk_600_c.bt
openresty-systemtap-toolkit-master/fix-lua-bt wrk_600_c.bt > wrk_600_c_flame.bt
FlameGraph-master/stackcollapse-stap.pl wrk_600_c_flame.bt > wrk_600_c_flame.cbt
FlameGraph-master/flamegraph.pl wrk_600_c_flame.cbt > wrk_600_c_flame.svg
测试结果
先说结论,后面有详细内容:
单机情况下,并发500情况下偶尔接口会有失败,/auth接口QPS在4000到5000,/activate接口QPS在3000到4000,平均响应时间在200ms以内
PS:wrk比ab感觉还要高效一点
ab: 所有请求post参数均相同,对于/activate接口测试参考不太大
接口/auth,到600并发时开始失败,QPS在4500到5000,平均响应时间在200ms以内
echo "===n-20000,c-600====" Server Software: openresty/1.11.2.5 Server Hostname: xxx.xxx.xxx.xxx Server Port: 8080 Document Path: /auth Document Length: 75 bytes Concurrency Level: 600 Time taken for tests: 27.057 seconds Complete requests: 100000 Failed requests: 7361 (Connect: 0, Receive: 0, Length: 7361, Exceptions: 0) Write errors: 0 Keep-Alive requests: 99378 Total transferred: 27682080 bytes Total POSTed: 21302982 HTML transferred: 7512428 bytes Requests per second: 3695.90 [#/sec] (mean) Time per request: 162.342 [ms] (mean) Time per request: 0.271 [ms] (mean, across all concurrent requests) Transfer rate: 999.12 [Kbytes/sec] received 768.88 kb/s sent 1768.01 kb/s total Connection Times (ms) min mean[+/-sd] median max Connect: 0 1 10.3 0 187 Processing: 2 160 90.3 183 931 Waiting: 1 160 90.3 183 931 Total: 2 161 91.3 183 931 Percentage of the requests served within a certain time (ms) 50% 183 66% 197 75% 208 80% 219 90% 259 95% 300 98% 387 99% 482 100% 931 (longest request) echo "===n-20000,c-500====" Server Software: openresty/1.11.2.5 Server Hostname: xxx.xxx.xxx.xxx Server Port: 8080 Document Path: /auth Document Length: 75 bytes Concurrency Level: 500 Time taken for tests: 19.454 seconds Complete requests: 100000 Failed requests: 0 Write errors: 0 Keep-Alive requests: 99305 Total transferred: 27647028 bytes Total POSTed: 21243480 HTML transferred: 7513725 bytes Requests per second: 5140.46 [#/sec] (mean) Time per request: 97.268 [ms] (mean) Time per request: 0.195 [ms] (mean, across all concurrent requests) Transfer rate: 1387.88 [Kbytes/sec] received 1066.42 kb/s sent 2454.29 kb/s total Connection Times (ms) min mean[+/-sd] median max Connect: 0 1 10.5 0 1014 Processing: 1 95 78.1 78 1064 Waiting: 1 95 78.1 77 1064 Total: 1 96 81.1 78 1093 Percentage of the requests served within a certain time (ms) 50% 78 66% 99 75% 116 80% 129 90% 178 95% 239 98% 339 99% 452 100% 1093 (longest request) echo "===n-20000,c-300====" Server Software: openresty/1.11.2.5 Server Hostname: xxx.xxx.xxx.xxx Server Port: 8080 Document Path: /auth Document Length: 75 bytes Concurrency Level: 300 Time taken for tests: 22.396 seconds Complete requests: 100000 Failed requests: 0 Write errors: 0 Keep-Alive requests: 99096 Total transferred: 27619216 bytes Total POSTed: 21181446 HTML transferred: 7506450 bytes Requests per second: 4465.14 [#/sec] (mean) Time per request: 67.187 [ms] (mean) Time per request: 0.224 [ms] (mean, across all concurrent requests) Transfer rate: 1204.33 [Kbytes/sec] received 923.61 kb/s sent 2127.95 kb/s total Connection Times (ms) min mean[+/-sd] median max Connect: 0 1 11.5 0 1074 Processing: 1 66 40.2 51 334 Waiting: 0 65 40.1 51 334 Total: 1 67 42.4 51 1115 Percentage of the requests served within a certain time (ms) 50% 51 66% 78 75% 95 80% 99 90% 118 95% 141 98% 172 99% 203 100% 1115 (longest request) |
/activate接口,QPS在3000到4000之间,平均响应时间在200ms左右
echo "=========n-20000,c-300===========" Server Software: openresty/1.11.2.5 Server Hostname: xxx.xxx.xxx.xxx Server Port: 8080 Document Path: /activate Document Length: 118 bytes Concurrency Level: 300 Time taken for tests: 5.516 seconds Complete requests: 20000 Failed requests: 0 Write errors: 0 Keep-Alive requests: 20000 Total transferred: 6400640 bytes Total POSTed: 4364930 HTML transferred: 2360236 bytes Requests per second: 3625.82 [#/sec] (mean) Time per request: 82.740 [ms] (mean) Time per request: 0.276 [ms] (mean, across all concurrent requests) Transfer rate: 1133.18 [Kbytes/sec] received 772.78 kb/s sent 1905.96 kb/s total Connection Times (ms) min mean[+/-sd] median max Connect: 0 1 9.8 0 109 Processing: 11 80 31.1 90 321 Waiting: 3 80 31.1 89 320 Total: 11 81 35.6 90 321 Percentage of the requests served within a certain time (ms) 50% 90 66% 94 75% 96 80% 99 90% 112 95% 120 98% 149 99% 263 100% 321 (longest request) echo "=========n-20000,c-500===========" Server Software: openresty/1.11.2.5 Server Hostname: xxx.xxx.xxx.xxx Server Port: 8080 Document Path: /activate Document Length: 118 bytes Concurrency Level: 500 Time taken for tests: 6.494 seconds Complete requests: 20000 Failed requests: 0 Write errors: 0 Keep-Alive requests: 19937 Total transferred: 6406725 bytes Total POSTed: 4412230 HTML transferred: 2362596 bytes Requests per second: 3079.82 [#/sec] (mean) Time per request: 162.347 [ms] (mean) Time per request: 0.325 [ms] (mean, across all concurrent requests) Transfer rate: 963.45 [Kbytes/sec] received 663.52 kb/s sent 1626.97 kb/s total Connection Times (ms) min mean[+/-sd] median max Connect: 0 3 20.1 0 168 Processing: 0 154 115.9 204 626 Waiting: 0 154 115.9 204 626 Total: 0 157 119.2 205 626 Percentage of the requests served within a certain time (ms) 50% 205 66% 230 75% 241 80% 252 90% 285 95% 327 98% 384 99% 395 100% 626 (longest request) |
wrk
接口/auth较为简单,QPS在4500到5000,平均响应时间在100ms以内,500并发时不到1%失败
Running 10s test @ http://xxx.xxx.xxx.xxx:8080/auth 1 threads and 500 connections Thread Stats Avg Stdev Max +/- Stdev Latency 77.14ms 109.04ms 1.94s 94.51% Req/Sec 4.70k 1.13k 8.22k 72.15% 46375 requests in 10.08s, 12.91MB read Socket errors: connect 0, read 0, write 0, timeout 3 Requests/sec: 4599.62 Transfer/sec: 1.28MB Running 10s test @ http://xxx.xxx.xxx.xxx:8080/auth 1 threads and 300 connections Thread Stats Avg Stdev Max +/- Stdev Latency 44.70ms 39.89ms 385.27ms 85.14% Req/Sec 5.07k 0.90k 7.12k 71.74% 50208 requests in 10.04s, 13.98MB read Requests/sec: 4999.79 Transfer/sec: 1.39MB |
接口/activate业务逻辑复杂些,和redis交互较多,QPS不到4000,响应时间在200ms以内,500并发测试时没有失败
Running 10s test @ http://172.25.253.58:8080/activate 1 threads and 300 connections Thread Stats Avg Stdev Max +/- Stdev Latency 68.31ms 44.00ms 307.91ms 72.40% Req/Sec 4.12k 1.11k 5.97k 62.89% 40992 requests in 10.05s, 12.78MB read Requests/sec: 4078.98 Transfer/sec: 1.27MB Running 10s test @ http://172.25.253.58:8080/activate 1 threads and 500 connections Thread Stats Avg Stdev Max +/- Stdev Latency 152.10ms 135.23ms 960.74ms 77.39% Req/Sec 3.63k 714.10 5.25k 79.17% 35869 requests in 10.10s, 11.19MB read Requests/sec: 3552.83 Transfer/sec: 1.11MB |
systemtap
/auth在300并发时
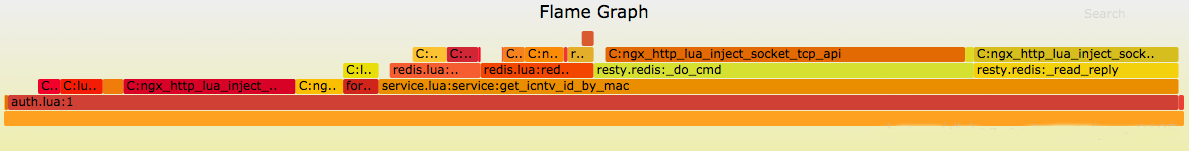
/auth接口
/activate在300并发时
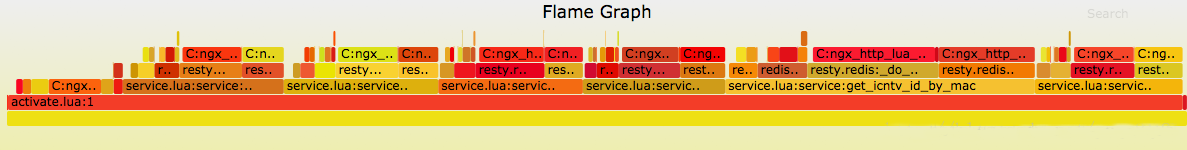
/activate接口
结论: 图中可看出没有明显性能瓶颈
其他相关
第一版代码由于不理解openresty的redis线程池,导致线程连接没处理好,并发性能较差,通过火焰图发现性能瓶颈,调整代码之后性能提高10倍左右,调整之前的ab和systemtap测试结果见下.
ab
========n-20000,c-300======================= Server Software: openresty/1.11.2.5 Server Hostname: xxx.xxx.xxx.xxx Server Port: 8080 Document Path: /auth Document Length: 75 bytes Concurrency Level: 300 Time taken for tests: 44.509 seconds Complete requests: 20000 Failed requests: 1023 (Connect: 0, Receive: 0, Length: 1023, Exceptions: 0) Write errors: 0 Keep-Alive requests: 20000 Total transferred: 5530650 bytes Total POSTed: 4293006 HTML transferred: 1501404 bytes Requests per second: 449.35 [#/sec] (mean) Time per request: 667.634 [ms] (mean) Time per request: 2.225 [ms] (mean, across all concurrent requests) Transfer rate: 121.35 [Kbytes/sec] received 94.19 kb/s sent 215.54 kb/s total Connection Times (ms) min mean[+/-sd] median max Connect: 0 1 9.6 0 103 Processing: 108 653 411.0 547 3806 Waiting: 6 653 411.0 547 3806 Total: 109 654 410.8 547 3806 Percentage of the requests served within a certain time (ms) 50% 547 66% 555 75% 564 80% 572 90% 621 95% 1669 98% 2418 99% 2514 100% 3806 (longest request) |
systemtap 
图中可看出程序执行的大部分时间都用在建立redis连接上了.
上文内容不用于商业目的,如涉及知识产权问题,请权利人联系博为峰小编(021-64471599-8017),我们将立即处理。


