对于一些服务来说,性能是极其重要的一环,事关系统的吞吐、访问的延迟,进而影响用户的体验。
写性能测试在Go语言中是很便捷的,go自带的标准工具链就有完善的支持,下面我们来从Go的内部和系统调用方面来详细剖析一下Benchmark这块儿。
benchmark
Go做Benchmar只要在目录下创建一个_test.go后缀的文件,然后添加下面函数:
func BenchmarkStringJoin1(b *testing.B) { b.ReportAllocs() input := []string{"Hello", "World"} for i := 0; i < b.N; i++ { result := strings.Join(input, " ") if result != "Hello World" { b.Error("Unexpected result: " + result) } } } |
调用以下命令:
# go test -run=xxx -bench=. -benchtime="3s" -cpuprofile profile_cpu.out |
该命令会跳过单元测试,执行所有benchmark,同时生成一个cpu性能描述文件.
有两个注意点:
1. -benchtime 可以控制benchmark的运行时间
2. b.ReportAllocs() ,在report中包含内存分配信息,例如结果是:
| BenchmarkStringJoin1-4 300000 4351 ns/op 32 B/op 2 allocs/op |
-4表示4个CPU线程执行;300000表示总共执行了30万次;4531ns/op,表示每次执行耗时4531纳秒;32B/op表示每次执行分配了32字节内存;2 allocs/op表示每次执行分配了2次对象。
根据上面的信息,我们就能对热点路径进行内存对象分配的优化。
例如针对上面的程序我们可以进行小小的优化:
func BenchmarkStringJoin2(b *testing.B) { b.ReportAllocs() input := []string{"Hello", "World"} join := func(strs []string, delim string) string { if len(strs) == 2 { return strs[0] + delim + strs[1]; } return ""; }; for i := 0; i < b.N; i++ { result := join(input, " ") if result != "Hello World" { b.Error("Unexpected result: " + result) } } } |
新的Benchmark结果是:
| BenchmarkStringJoin2-4 500000 2440 ns/op 16 B/op 1 allocs/op |
可以看出来,在减少了内存分配后,性能提升了60%以上!
cpu profile
上一节的benchmark结果,我们只能看到函数的整体性能,但是如果该函数较为复杂呢?然后我们又想知道函数内部的耗时,这时就该Cpu Profile登场了。
Cpu profile是Go语言工具链中最闪耀的部分之一,掌握了它以及memory、block profile,那基本上就没有你发现不了的性能瓶颈了。
之前的benchmark同时还生成了一个profile_cpu.out文件,这里我们执行下面的命令:
# go tool pprof app.test profile_cpu.out Entering interactive mode (type "help" for commands) (pprof) top10 8220ms of 10360ms total (79.34%) Dropped 63 nodes (cum <= 51.80ms) Showing top 10 nodes out of 54 (cum >= 160ms) flat flat% sum% cum cum% 2410ms 23.26% 23.26% 4960ms 47.88% runtime.concatstrings 2180ms 21.04% 44.31% 2680ms 25.87% runtime.mallocgc 1200ms 11.58% 55.89% 1200ms 11.58% runtime.memmove 530ms 5.12% 61.00% 530ms 5.12% runtime.memeqbody 530ms 5.12% 66.12% 2540ms 24.52% runtime.rawstringtmp 470ms 4.54% 70.66% 2420ms 23.36% strings.Join 390ms 3.76% 74.42% 2330ms 22.49% app.BenchmarkStringJoin3B 180ms 1.74% 76.16% 1970ms 19.02% runtime.rawstring 170ms 1.64% 77.80% 5130ms 49.52% runtime.concatstring3 160ms 1.54% 79.34% 160ms 1.54% runtime.eqstring |
上面仅仅展示部分函数的信息,并没有调用链路的性能分析,因此如果需要完整信息,我们要生成svg或者pdf图。
# go tool pprof -svg profile_cpu.out > profile_cpu.svg # go tool pprof -pdf profile_cpu.out > profile_cpu.pdf |
下面是profile_cpu.pdf的图:
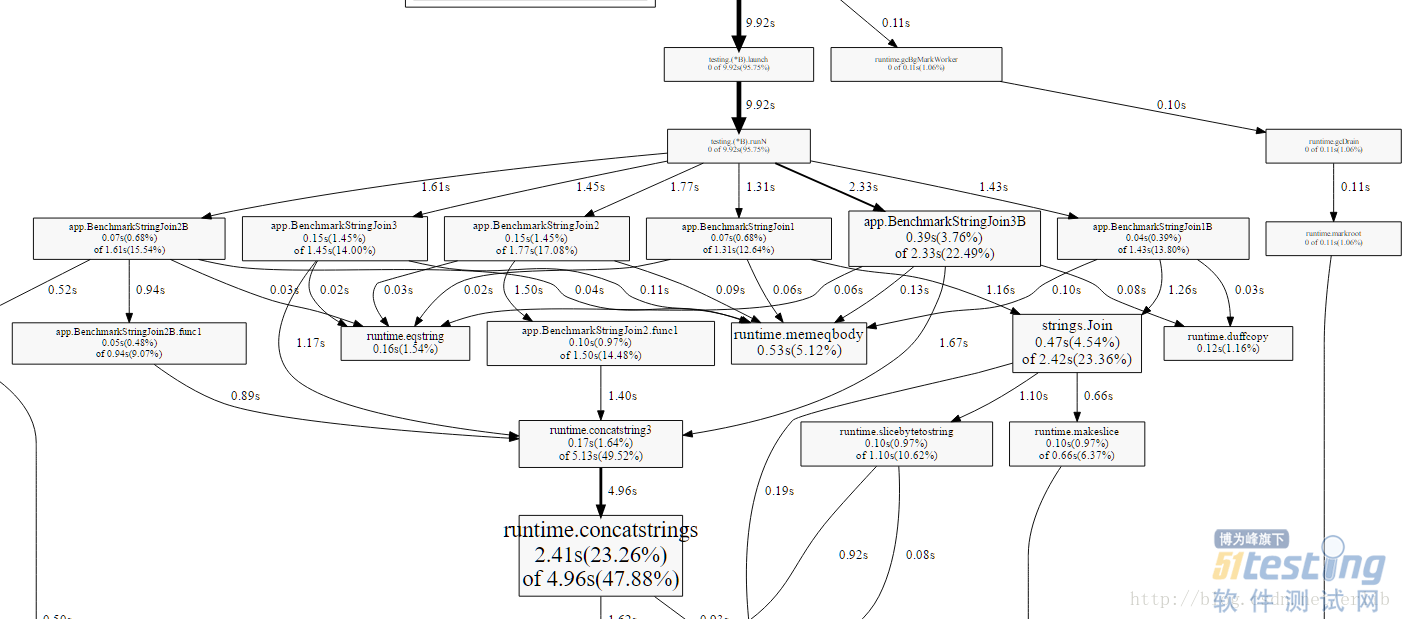
可以看到图里包含了多个benchmark的合集(之前的两段benmark函数都在同一个文件中),但是我们只关心性能最差的那个benchmark,因此需要过滤:
go test -run=xxx -bench=BenchmarkStringJoin2B$ -cpuprofile profile_2b.out go test -run=xxx -bench=BenchmarkStringJoin2$ -cpuprofile profile_2.out go tool pprof -svg profile_2b.out > profile_2b.svg go tool pprof -svg profile_2.out > profile_2.svg |
 根据图片展示,benchmark自身的函数(循环之外的函数)runtime.concatstrings触发了内存对象的分配,造成了耗时,但是跟踪到这里,我们已经无法继续下去了,因此下面就需要flame graphs 了。
 “A flame graph is a good way to drill down your benchmarks, finding your bottlenecks #golang” via @TitPetric |
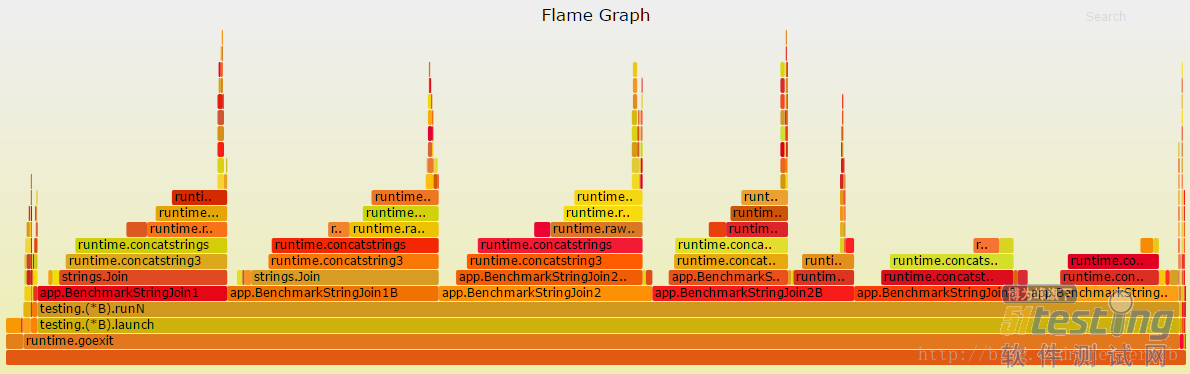 如果想详细查看,你只要点击这些矩形块就好。
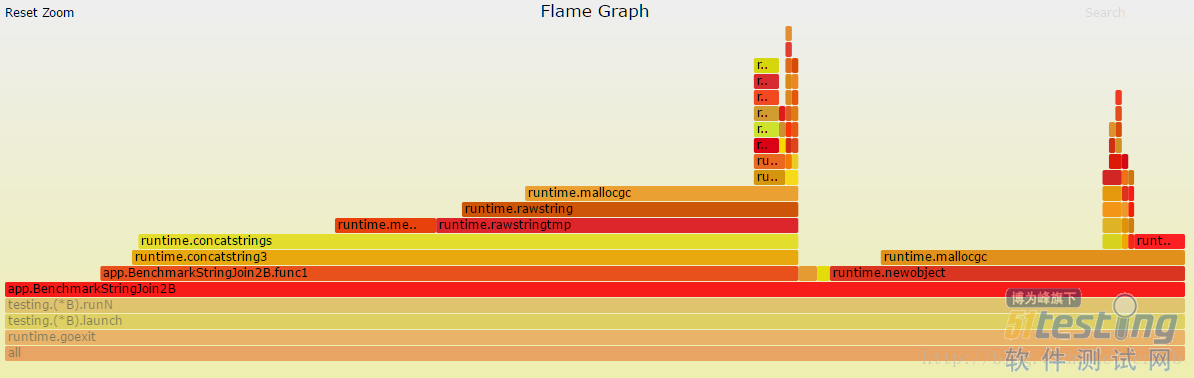
生成这些图,我们需要 uber/go-torch这个库,这个库使用了https://github.com/brendangregg/FlameGraph,下面是一个自动下载依赖,然后生成frame graph的脚本,读者可以根据需要,自己实现。
#!/bin/bash # install flamegraph scripts if [ ! -d "/opt/flamegraph" ]; then echo "Installing flamegraph (git clone)" git clone --depth=1 https://github.com/brendangregg/FlameGraph.git /opt/flamegraph fi # install go-torch using docker if [ ! -f "bin/go-torch" ]; then echo "Installing go-torch via docker" docker run --net=party --rm=true -it -v $(pwd)/bin:/go/bin golang go get github.com/uber/go-torch # or if you have go installed locally: go get github.com/uber/go-torch fi PATH="$PATH:/opt/flamegraph" bin/go-torch -b profile_cpu.out -f profile_cpu.torch.svg |
至此,我们的benchmark之路就告一段落,但是上面所述的cpu profile不仅仅能用在benchmark中,还能直接在线debug生产环境的应用性能,具体的就不详细展开,该系列后续文章会专门讲解, 下面是本文完整的benchmark代码
package main import "testing" import "strings" func BenchmarkStringJoin1(b *testing.B) { b.ReportAllocs() input := []string{"Hello", "World"} for i := 0; i < b.N; i++ { result := strings.Join(input, " ") if result != "Hello World" { b.Error("Unexpected result: " + result) } } } func BenchmarkStringJoin1B(b *testing.B) { b.ReportAllocs() for i := 0; i < b.N; i++ { input := []string{"Hello", "World"} result := strings.Join(input, " ") if result != "Hello World" { b.Error("Unexpected result: " + result) } } } func BenchmarkStringJoin2(b *testing.B) { b.ReportAllocs() input := []string{"Hello", "World"} join := func(strs []string, delim string) string { if len(strs) == 2 { return strs[0] + delim + strs[1]; } return ""; }; for i := 0; i < b.N; i++ { result := join(input, " ") if result != "Hello World" { b.Error("Unexpected result: " + result) } } } func BenchmarkStringJoin2B(b *testing.B) { b.ReportAllocs() join := func(strs []string, delim string) string { if len(strs) == 2 { return strs[0] + delim + strs[1]; } return ""; }; for i := 0; i < b.N; i++ { input := []string{"Hello", "World"} result := join(input, " ") if result != "Hello World" { b.Error("Unexpected result: " + result) } } } func BenchmarkStringJoin3(b *testing.B) { b.ReportAllocs() input := []string{"Hello", "World"} for i := 0; i < b.N; i++ { result := input[0] + " " + input[1]; if result != "Hello World" { b.Error("Unexpected result: " + result) } } } func BenchmarkStringJoin3B(b *testing.B) { b.ReportAllocs() for i := 0; i < b.N; i++ { input := []string{"Hello", "World"} result := input[0] + " " + input[1]; if result != "Hello World" { b.Error("Unexpected result: " + result) } } } |