
-
Jmeter实现WebSocket协议的性能测试方法
2018-12-26 09:34:22
一、场景选择websocket协议性能测试场景通常包括:1、websocket并发连接和关闭;2、websocket消息并发连接的大数据推送;3、websocket长时间链接,稳定性测试;二、工具选择Jmeter+websocket sampler三、方法1.获取websocket samplar https://github.com/maciejzaleski/JMeter-WebSocketSampler下载源码并打成jar包2、在maven 仓库中下载依赖的jar包https://mvnrepository.com/jetty-http-9.1.1.v20140108.jarjetty-io-9.1.1.v20140108.jarjetty-util-9.1.1.v20140108.jarwebsocket-api-9.1.1.v20140108.jarwebsocket-client-9.1.1.v20140108.jarwebsocket-common-9.1.1.v20140108.jar3、将jar包放到jmeter的 lib/ext/文件下面4、重启jmeter四、测试过程1、创建线程组、websokcet sampler、结果集,查看结果树等内容;2、输入内容解释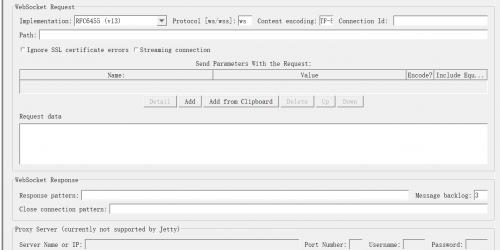 一、Web Server1.Server Name or IP:被测 WebSocket服务器的域名或IP2.Port Number: 被测WebSocket服务器的端口号。二、Timeout1.Connection:链接建立的最大超时时间,单位毫秒。如果达到超时时间设置后链接未建立,则sampler失败。2.Response:对响应消息的最大等待时间,单位毫秒。到达设定时间后WebSocket链接关闭。三、WebSocket Request1.Implementation:仅支持 RFC6455(v13)2.Protocol:ws——普通的WebSocket链接,或wss——安全的WebSocket链接(WebSocket Secure connection)3.Path、同请求一起发送参数、Request Data:与http采样器类似,结合被测接口说明文档来进行配置
 -
找出UNIX中最费CPU的进程
2011-09-16 15:29:59
多用户的UNIX计算机系统在运行过程中,有时会感觉到运算速度突然慢下来,有时甚至连从键盘输入字符也得过好久才会有反应。有经验的人一定会知道,这时计算机中一定在运行一个非常耗费CPU的进程。这样的进程有时是某个人在执行一个很占CPU的程序,有时则可能是系统中出了意外情况,系统本身在进行处理。无论是哪种情况,系统管理员都应及时找出这样的进程,并做出相应的处理。UNIX虽然提供了“acct”等一系列记账程序,但这些程序只能在进程结束后才能显示运行时间和占用CPU时间等信息,不能实时计算单位时间内哪一个进程占用CPU时间最多。
为此本人用shell语言编写了一段程序,利用UNIX提供的一些实用程序,实现了上述功能。
此段程序中包含ps、cut、diff等UNIX实用程序,下面先简单介绍一下这些实用程序的功能。
ps:用来显示当前系统中进程的有关信息。用-e参数则显示系统中所有进程的信息。使用-f参数则显示各进程完整的信息;
cut:用于以列为单位对文件进行剪裁。参数“-c -15,33-”表示把输入文件每行前15个字符及第33个字符以后直到行尾的所有字符放入输出文件;
echo:用于向屏幕上显示提示信息;
sleep:可以让shell程序等待若干秒,然后再执行后面的语句;
diff:用于对两个文件进行比较,不同之处则显示出来;
sort:可对文件中的各行进行排序,排序结果可显示出来;
grep:可用来找出文件中满足一定条件的行。参数“^”表示找出第一列为空格的各行;
|:为管道的符号,可实现把前面命令的输出作为后面命令输入的作用,这样就可省略生成中间文件的步骤,提高执行效率;
>:表示对输出进行重定向,把本来应显示在屏幕上的东西输出到文件中。
程序内容如下:
ps -ef|cut -c -15,33->tt1
echo Please wait a while...
sleep 20
ps -ef|cut -c -15,33->tt2
echo Attention !
echo
diff tt1 tt2|cut -c 2->tt3
sort tt3|grep ^ |cut -c -83|grep -v 0:00
echo
echo That is ok!
rm tt1 tt2 tt3
程序首先取得系统中所有进程的信息并把其中有用的字段放入临时文件tt1中。接着让程序等待20秒(时间可依具体情况进行调整)。
然后再一次取得所有进程的信息,并把所有的字段放入临时文件tt2中。
对两个临时文件进行比较,找出20秒前后信息不同的那些进程(其中就有消耗CPU时间已经发生了变化的进程)。
去掉进行比较时产生的“>”和“<”,把结果放入临时文件tt3中。
对tt3中的内容进行排序,把耗费CPU时间发生变化的同一进程的前后信息排在一起。grep“^”则是用来去掉执行此shell程序时产生的一些中间命令进程的信息。
再用cut删去每行中过长的进程信息,使输出更加清晰。而grep -v 0:00则用来去掉20秒前后只出现一次的进程。程序执行至此,在20秒前后耗费CPU时间不同的进程就显示在屏幕上了,从中可以很容易地找出所要找的进程。最后为了不在系统中留下无用的垃圾文件,还要把三个临时文件全都删去。
-
使用unix工具监控cpu、内存等系统资源占用率
2011-09-16 15:16:20
1)使用 sar -u 命令监控cpu使用
$ sar -u 5 5
12:21:15 %usr %sys %wio %idle
12:21:20 54 15 13 19
12:21:25 41 18 15 27
12:21:30 62 20 10 9
12:21:35 33 11 20 36
12:21:40 38 13 17 31
Average 45 15 15 24
%usr--运行在用户模式下cpu的使用百分比
%sys--运行在系统模式下cpu的使用百分比
%wio--进程在等待块I/O时闲置状态下cpu的使用百分比
%idle--闲置状态时cpu的使用百分比
很低的%idle说明cpu负载高,或者cpu处理能力不足,或者也可能是I/O问题。
很高的%wio,即系统I/O繁忙,进程获得cpu但在等I/O,这部分时间的比例,有可能是I/O存在问题。
2)使用top命令发现系统中最影响性能的用户
load averages: 2.83, 3.30, 3.67
143 processes: 124 sleeping, 15 running, 4 on cpu
CPU states: 45.9% idle, 24.8% user, 7.3% kernel, 22.0% iowait, 0.0% swap
Memory: 2048M real, 36M free, 2920M swap in use, 982M swap free
PID USERNAME LWP PRI NICE SIZE RES STATE TIME CPU COMMAND
23696 oracle 11 52 0 586M 536M run 279:55 7.57% oracle
19184 oracle 11 53 0 586M 536M run 166:47 2.51% oracle
11303 oracle 11 53 0 742M 698M run 25.2H 1.43% oracle
8156 oracle 11 48 0 741M 695M run 28.7H 0.96% oracle
12786 oracle 11 59 0 588M 529M run 111.8H 0.94% oracle
15222 oracle 11 49 0 741M 695M cpu/8 30.9H 0.85% oracle
2924 oracle 11 59 0 748M 688M sleep 107.5H 0.83% oracle
8178 oracle 11 59 0 741M 695M cpu/0 28.8H 0.81% oracle
15220 oracle 11 54 0 741M 697M run 31.4H 0.78% oracle
8168 oracle 11 39 0 741M 697M run 30.0H 0.77% oracle
15216 oracle 11 59 0 741M 697M cpu/9 30.1H 0.77% oracle
8164 oracle 11 39 0 741M 695M run 30.8H 0.76% oracle
11267 oracle 11 59 0 741M 697M sleep 32.3H 0.74% oracle
15214 oracle 11 59 0 741M 695M sleep 30.9H 0.70% oracle
11861 oracle 1 59 0 739M 696M sleep 16.9H 0.67% oracle
3)使用uptime命令监控cpu负载
$ uptime
12:45pm up 119 day(s), 19:01, 1 user, load average: 2.96, 2.98, 3.30
提供快速查看cpu中所有任务(包括正在运行的任务)在1分钟,5分钟,15分钟内的负载。在sun下是1,5,15分钟,在digital unix下是5,30,60分钟。
4)使用mpstat命令确定cpu瓶颈
$ mpstat 10 3
CPU minf mjf xcal intr ithr csw icsw migr smtx srw syscl usr sys wt idl
0 91 14 127 406 245 97 49 62 45 0 351 25 9 9 57
1 106 16 145 174 101 312 70 111 33 0 327 27 6 10 56
4 99 16 83 173 101 294 68 108 33 0 290 26 6 10 58
5 102 17 126 184 110 313 70 115 33 0 336 26 6 10 57
8 97 17 127 174 101 302 69 113 33 0 299 25 6 11 58
9 93 11 335 329 274 239 61 103 59 0 217 23 10 7 60
CPU minf mjf xcal intr ithr csw icsw migr smtx srw syscl usr sys wt idl
0 19 33 3504 2160 1920 791 99 116 77 0 1401 30 17 12 42
1 82 39 1908 264 101 1210 157 215 49 0 2394 39 8 18 35
4 126 45 1839 276 102 1269 167 224 51 0 2511 34 9 14 43
5 133 49 2298 293 107 1384 178 239 53 0 2840 36 8 18 39
8 95 46 2772 266 101 1266 158 214 47 0 2638 38 7 14 40
9 115 38 2961 986 847 1173 158 213 88 0 2401 34 13 13 41
CPU minf mjf xcal intr ithr csw icsw migr smtx srw syscl usr sys wt idl
0 74 30 2438 1960 1743 670 65 100 66 0 1232 25 14 14 47
1 63 40 1615 229 101 1158 123 192 47 0 2277 35 6 14 44
4 145 28 1396 249 101 1148 142 190 42 0 2397 32 8 14 47
5 73 28 1588 253 107 1213 141 202 47 0 2578 32 8 9 51
8 44 29 3181 252 101 1210 146 187 39 0 2471 30 10 9 51
9 67 24 1345 823 727 1024 105 178 83 0 2006 26 9 9 55
mpstat命令是一个sun solaris工具,以报表形式报告每个处理器的统计数据。表的每一行代表一个处理器的活动情况。第一张表显示了自启动以来各种活动情况的总结。注意 smtx项,它代表cpu尝试获取一个互斥锁定(mutex)失败的次数。mutex机制浪费cpu时间,并且降低多处理器的伸缩性能。如果stmx列的 值大于200,说明将遇到cpu瓶颈问题。
5)使用sar命令监控磁盘I/O问题
$ sar -d 5 2
12:59:00 device %busy avque r+w/s blks/s avwait avserv
12:59:05 md30 71 0.8 103 1738 0.0 7.5
md31 34 0.4 52 934 0.0 7.1
md32 39 0.4 52 925 0.0 8.6
sd10 42 0.5 57 1001 0.0 9.0
sd10,a 0 0.0 0 0 0.0 0.0
sd10,b 0 0.0 0 0 0.0 0.0
sd10,c 0 0.0 0 0 0.0 0.0
12:59:10 md30 9 0.1 5 312 0.0 27.4
md31 4 0.1 4 277 0.0 16.1
md32 7 0.1 4 289 0.0 28.2
sd10 26 0.4 36 787 0.0 11.0
sd10,a 5 0.1 7 106 0.0 7.9
sd10,b 3 0.0 1 24 0.0 28.4
sd10,c 0 0.0 0 0 0.0 0.0
Average md30 40 0.5 54 1025 0.0 8.5
md31 19 0.2 28 606 0.0 7.7
md32 23 0.3 28 607 0.0 10.0
sd10 34 0.5 47 894 0.0 9.7
sd10,a 3 0.0 3 53 0.0 7.9
sd10,b 2 0.0 1 12 0.0 28.4
sd10,c 0 0.0 0 0 0.0 0.0
-d选项监控磁盘I/O
%busy
avque--平均队列长度
r+w/s--读和写的活动
blks/s--传送的数据块的数量
avwait--平均等待时间
avserv--平均服务时间
较高的%busy和avque意味着出现了磁盘I/O瓶颈。
$ sar -b 2 5
17:08:24 bread/s lread/s %rcache bwrit/s lwrit/s %wcache pread/s pwrit/s
17:08:26 0 530 100 2 2 0 0 0
17:08:28 0 536 100 3 3 0 0 0
17:08:31 0 339 100 0 1 67 0 0
17:08:33 0 332 100 1 3 67 0 0
17:08:35 0 343 100 3 57 95 0 0
Average 0 416 100 2 13 85 0 0
-b选项报告缓冲区活动,它等同于磁盘I/O活动。如果怀疑数据库I/O有问题,这个命令很有用。
bread/s--每秒钟从磁盘进行物理读入的数量
lread/s--每秒中从缓冲区读入的数量
%rcache--读入请求的缓冲区命中率
bwrit/s--每秒钟向磁盘物理写入的数量,它给dba提供了服务器上整体写入活动的指标
lwrit/s--每秒钟向缓冲区写入的数量
%wcache--写入请求的缓冲区命中率
pread/s--每秒钟从磁盘读入的数量,这个是I/O子系统上负载的极好度量
pwrit/s--每秒钟写入磁盘的数量
6)使用iostat确定磁盘I/O瓶颈
iostat可以用于报告终端和磁盘I/O活动情况,确定磁盘瓶颈。输出结果的第一行显示了自数据库启动以来各种I/O的统计数据。最常用的选项有-d,-x,-D,-c(cpu负载)。
$ iostat -d md30 md31 md32 sd10 5 5
md30 md31 md32 sd10
kps tps serv kps tps serv kps tps serv kps tps serv
9 1 13 7 0 15 7 0 14 46 6 14
112 14 11 56 7 12 56 7 10 439 46 14
24 3 8 13 2 6 11 1 10 51 6 8
3 0 12 2 0 14 2 0 9 89 10 7
3 0 25 2 0 40 2 0 10 34 19 29
-d选项可以列出每秒传送的字节数,每秒的传输次数以及平均服务时间(以毫秒计)。-d仅仅显示I/O,不区分读操作和写操作。
$ iostat -D md30 md31 md32 sd10 5 5
md30 md31 md32 sd10
rps wps util rps wps util rps wps util rps wps util
1 0 0.5 0 0 0.3 0 0 0.3 4 3 4.3
53 3 30.4 27 3 18.3 27 3 14.0 38 5 20.9
5 0 6.2 2 0 3.9 2 0 3.7 3 6 7.0
2 10 11.5 1 10 9.3 1 10 7.6 56 19 41.9
5 0 3.3 3 0 1.6 3 0 1.6 7 1 4.6
-D选项报告每秒的读操作数量,写操作数量以及磁盘使用率。
$ iostat -x 5 3
extended device statistics
device r/s w/s kr/s kw/s wait actv svc_t %w %b
md30 0.5 0.1 4.0 4.5 0.0 0.0 12.8 0 0
md31 0.3 0.1 2.0 4.5 0.0 0.0 14.6 0 0
md32 0.3 0.1 2.0 4.5 0.0 0.0 14.1 0 0
sd10 3.6 2.6 37.0 8.6 0.0 0.1 14.1 0 4
extended device statistics
device r/s w/s kr/s kw/s wait actv svc_t %w %b
md30 0.8 0.0 6.4 0.0 0.0 0.0 12.0 0 1
md31 0.4 0.0 3.2 0.0 0.0 0.0 13.0 0 1
md32 0.4 0.0 3.2 0.0 0.0 0.0 11.0 0 0
sd10 5.8 1.0 65.6 3.5 0.0 0.1 8.1 0 5
extended device statistics
device r/s w/s kr/s kw/s wait actv svc_t %w %b
md30 0.4 0.0 3.2 0.0 0.0 0.0 11.8 0 0
md31 0.2 0.0 1.6 0.0 0.0 0.0 12.7 0 0
md32 0.2 0.0 1.6 0.0 0.0 0.0 10.9 0 0
sd10 0.2 1.2 1.6 3.8 0.0 0.0 16.9 0 2
-x选项报告所有磁盘的扩展磁盘统计数据
7)使用sar命令和vmstat命令监控分页/交换
一种可以快速判定自系统启动以来是否存在任何交换活动的方法就是运行vmstat -S命令,如果swp/in和swp/out列出现非零值,就说明很可能出现了问题。另外可以使用sar命令挖掘更多的信息。
可以使用sar命令来检查系统的分页/交换活动。任何分页和交换现象都预示着将出现问题。在虚拟内存系统中,如果当前非活动用户(的进程)从内存移到磁盘 上时,就会出现分页现象(一个小问题)。而如果由于内存的不足造成当前活动用户(的进程)被移到了磁盘上,就会出现交换现象(问题很严重)。分页不像交换 那么糟糕,但是随着分页的增加,很快就会出现交换。
$ sar -p 5 5
15:15:44 atch/s pgin/s ppgin/s pflt/s vflt/s slock/s
15:15:49 109.15 302.58 351.29 154.67 680.91 0.40
15:15:54 293.25 287.50 317.86 380.95 1447.82 0.00
15:15:59 146.41 418.92 485.86 71.51 327.09 0.00
15:16:04 96.03 386.90 429.56 92.86 362.70 0.00
15:16:09 197.81 495.63 526.64 340.76 983.70 0.00
Average 168.56 378.26 422.18 208.23 760.73 0.08
-p选项报告分页活动
atch/s--每秒的分页故障数据,可通过在内存中重新声明一个页来解决故障(每秒的附件)
pgin/s--每秒换进pagein请求数
ppgin/s--每秒换进的页数
pflt/s--每秒保护错误中的分页错误数(非法访问页)或者copy-on-write(写入时拷贝)数
vflt/s--每秒翻译页错误数(不在内存中的有效页)
slock/s--每秒因软件锁请求物理I/O引起的错误数
$ sar -w 5 5
15:25:00 swpin/s bswin/s swpot/s bswot/s pswch/s
15:25:05 0.00 0.0 0.00 0.0 6520
15:25:10 0.00 0.0 0.00 0.0 6190
15:25:15 0.00 0.0 0.00 0.0 5432
15:25:20 0.00 0.0 0.00 0.0 5239
15:25:25 0.00 0.0 0.00 0.0 5620
Average 0.00 0.0 0.00 0.0 5800
-w选项报告交换和内存切换活动
swpin/s--每秒进程换入的数量
bswin/s--每秒512个字节的换入数量
swpot/s--每秒进程换出的数量
bswot/s--每秒512个字节的换出数量
pswch/s--每秒进程上下文切换的数量
$ sar -r 5 5
15:26:50 freemem freeswap
15:26:55 4544 1998060
15:27:00 4032 1995139
15:27:05 4325 1991663
15:27:10 4372 1991611
15:27:15 4522 1987298
Average 4360 1992754
-r选项报告空闲内存和空闲交换
当freemem(空闲内存--以512字节为单位列出)低于一个特定的水平时,系统就开始分页。如果它继续下降,系统就开始将一些进程交换出去。这个一个系统性能快速恶化的信号,可以查找占用过多内存的进程,或者是否存在过多的进程。
$ sar -g 5 5
15:35:46 pgout/s ppgout/s pgfree/s pgscan/s %ufs_ipf
15:35:51 43.54 58.45 57.06 0.00 0.00
15:35:56 5.95 7.94 7.54 0.00 0.00
15:36:01 105.59 132.73 224.95 1230.94 0.00
15:36:06 38.22 46.53 81.39 412.67 0.00
15:36:11 11.33 13.12 12.72 0.00 0.00
Average 40.86 51.67 76.59 327.94 0.00
-g选项报告分页活动
pgout/s--每秒换出(pageout)请求数
ppgout/s--每秒换出(pageout)的页数
pgfree/s--由分页控制程序每秒放入空闲列表的页数
pgscan/s--由分页控制程序每秒扫描的分页数
%ufs_ipf--UFS incode与由iget获取的有重用页的空闲列表的比例。这些页已被填充,无法被进程重新声明使用。这样,它就是iget造成的页面填充比例。
很高的ppgout(从内存中移出的页面数)也说明内存不足的问题。
8)使用ipcs命令确定共享内存的使用情况
ipcs命令可以用来监控sga的使用情况。它报告sga中每个共享内存段的尺寸。如果在整个sga中没有足够的内存来容纳一个连续的内存段,sga就将 建立非连续的内存段。在实例崩溃的情况下,可能就会出现内存无法释放的问题。如果发生了这样的情况,注意ipcrm命令可以清除这些段(ipcrm -m用于内存段,ipcrm -s用于信号段)。
$ ipcs -b
IPC status from as of Sat Jan 7 16:04:05 CST 2006
T ID KEY MODE OWNER GROUP QBYTES
Message Queues:
T ID KEY MODE OWNER GROUP SEGSZ
Shared Memory:
m 4608 0xdf00bc84 --rw-r----- oracle dba 708837376
m 4609 0xbd76b6f0 --rw-r----- oracle dba 541065216
T ID KEY MODE OWNER GROUP NSEMS
Semaphores:
s 65536 0xae97 --ra------- root root 129
s 1 0x100ae97 --ra------- root root 128
s 2 0x1 --ra-ra-ra- root root 1
s 3 0x73657276 --ra-ra-ra- root root 3
s 1245188 0xd8647e24 --ra-r----- oracle dba 504
s 1245189 0xbcdcaaa8 --ra-r----- oracle dba 304
这里,sga建立了2个非连续的段。通常最好是让整个sga处于一个单一的共享内存段,因为跟踪一个以上的段以及在这些段之间来回切换都需要额外的开销。可以在/etc/system文件中增加参数SHMMAX的设置,以增加一个单一的共享内存段的最大尺寸。 -
内存泄露,内存溢出和死锁
2009-11-23 16:20:54
一内存泄露
内存泄漏指由于疏忽或错误造成程序未能释放已经不再使用的内存的情况。内存泄漏并非指内存在物理上的消失,而是应用程序分配某段内存后,由于设计错误,失去了对该段内存的控制,因而造成了内存的浪费。内存泄漏与许多其他问题有着相似的症状,并且通常情况下只能由那些可以获得程序源代码的程序员才可以分析出来。然而,有不少人习惯于把任何不需要的内存使用的增加描述为内存泄漏,即使严格意义上来说这是不准确的。
一般我们常说的内存泄漏是指堆内存的泄漏。堆内存是指程序从堆中分配的,大小任意的(内存块的大小可以在程序运行期决定),使用完后必须显示释放的内存。应用程序一般使用malloc,realloc,new等函数从堆中分配到一块内存,使用完后,程序必须负责相应的调用free或delete释放该内存块,否则,这块内存就不能被再次使用,我们就说这块内存泄漏了。
内存泄漏可以分为4类:
1. 常发性内存泄漏。发生内存泄漏的代码会被多次执行到,每次被执行的时候都会导致一块内存泄漏。
2. 偶发性内存泄漏。发生内存泄漏的代码只有在某些特定环境或操作过程下才会发生。常发性和偶发性是相对的。对于特定的环境,偶发性的也许就变成了常发性的。所以测试环境和测试方法对检测内存泄漏至关重要。
3. 一次性内存泄漏。发生内存泄漏的代码只会被执行一次,或者由于算法上的缺陷,导致总会有一块仅且一块内存发生泄漏。比如,在一个Singleton类的构造函数中分配内存,在析构函数中却没有释放该内存。而Singleton类只存在一个实例,所以内存泄漏只会发生一次。
4. 隐式内存泄漏。程序在运行过程中不停的分配内存,但是直到结束的时候才释放内存。严格的说这里并没有发生内存泄漏,因为最终程序释放了所有申请的内存。但是对于一个服务器程序,需要运行几天,几周甚至几个月,不及时释放内存也可能导致最终耗尽系统的所有内存。所以,我们称这类内存泄漏为隐式内存泄漏。内存泄漏会因为减少可用内存的数量从而降低计算机的性能。最终,在最糟糕的情况下,过多的可用内存被分配掉导致全部或部分设备停止正常工作,或者应用程序崩溃。
内存泄漏可能不严重,甚至能够被常规的手段检测出来。在现代操作系统中,一个应用程序使用的常规内存在程序终止时被释放。这表示一个短暂运行的应用程序中的内存泄漏不会导致严重后果。
在以下情况,内存泄漏导致较严重的后果:
* 程序运行后置之不理,并且随着时间的流失消耗越来越多的内存(比如服务器上的后台任务,尤其是嵌入式系统中的后台任务,这些任务可能被运行后很多年内都置之不理);
* 新的内存被频繁地分配,比如当显示电脑游戏或动画视频画面时;
* 程序能够请求未被释放的内存(比如共享内存),甚至是在程序终止的时候;
* 泄漏在操作系统内部发生;
* 泄漏在系统关键驱动中发生;
* 内存非常有限,比如在嵌入式系统或便携设备中;
* 当运行于一个终止时内存并不自动释放的操作系统(比如AmigaOS)之上,而且一旦丢失只能通过重启来恢复。2内存溢出
内存溢出已经是软件开发历史上存在了近40年的“老大难”问题,象在“红色代码”病毒事件中表现的那样,它已经成为黑客攻击企业网络的“罪魁祸首”。 如在一个域中输入的数据超过了它的要求就会引发数据溢出问题,多余的数据就可以作为指令在计算机上运行。据有关安全小组称,操作系统中超过50%的安全漏洞都是由内存溢出引起的,其中大多数与微软的技术有关。
为了便于理解,我们不妨打个比方。缓冲区溢出好比是将十磅的糖放进一个只能装五磅的容器里。一旦该容器放满了,余下的部分就溢出在柜台和地板上,弄得一团糟。由于计算机程序的编写者写了一些编码,但是这些编码没有对目的区域或缓冲区——五磅的容器——做适当的检查,看它们是否够大,能否完全装入新的内容——十磅的糖,结果可能造成缓冲区溢出的产生。如果打算被放进新地方的数据不适合,溢得到处都是,该数据也会制造很多麻烦。但是,如果缓冲区仅仅溢出,这只是一个问题。到此时为止,它还没有破坏性。当糖溢出时,柜台被盖住。可以把糖擦掉或用吸尘器吸走,还柜台本来面貌。与之相对的是,当缓冲区溢出时,过剩的信息覆盖的是计算机内存中以前的内容。除非这些被覆盖的内容被保存或能够恢复,否则就会永远丢失。
在丢失的信息里有能够被程序调用的子程序的列表信息,直到缓冲区溢出发生。另外,给那些子程序的信息——参数——也丢失了。这意味着程序不能得到足够的信息从子程序返回,以完成它的任务。就像一个人步行穿过沙漠。如果他依赖于他的足迹走回头路,当沙暴来袭抹去了这些痕迹时,他将迷失在沙漠中。这个问题比程序仅仅迷失方向严重多了。入侵者用精心编写的入侵代码(一种恶意程序)使缓冲区溢出,然后告诉程序依据预设的方法处理缓冲区,并且执行。此时的程序已经完全被入侵者操纵了。
入侵者经常改编现有的应用程序运行不同的程序。例如,一个入侵者能启动一个新的程序,发送秘密文件(支票本记录,口令文件,或财产清单)给入侵者的电子邮件。这就好像不仅仅是沙暴吹了脚印,而且后来者也会踩出新的脚印,将我们的迷路者领向不同的地方,他自己一无所知的地方。
缓冲区溢出的处理
你屋子里的门和窗户越少,入侵者进入的方式就越少……
由于缓冲区溢出是一个编程问题,所以只能通过修复被破坏的程序的代码而解决问题。如果你没有源代码,从上面“堆栈溢出攻击”的原理可以看出,要防止此类攻击,我们可以:
1、开放程序时仔细检查溢出情况,不允许数据溢出缓冲区。由于编程和编程语言的原因,这非常困难,而且不适合大量已经在使用的程序;
2、使用检查堆栈溢出的编译器或者在程序中加入某些记号,以便程序运行时确认禁止黑客有意造成的溢出。问题是无法针对已有程序,对新程序来讲,需要修改编译器;
3、经常检查你的操作系统和应用程序提供商的站点,一旦发现他们提供的补丁程序,就马上下载并且应用在系统上,这是最好的方法。但是系统管理员总要比攻击者慢一步,如果这个有问题的软件是可选的,甚至是临时的,把它从你的系统中删除。举另外一个例子,你屋子里的门和窗户越少,入侵者进入的方式就越少。3死锁
因为系统资源不足。
进程运行推进的顺序不合适。
资源分配不当等。
如果系统资源充足,进程的资源请求都能够得到满足,死锁出现的可能性就很低,否则就会因争夺有限的资源而陷入死锁。其次,进程运行推进顺序与速度不同,也可能产生死锁。产生死锁的四个必要条件
互斥条件:一个资源每次只能被一个进程使用。
请求与保持条件:一个进程因请求资源而阻塞时,对已获得的资源保持不放。
不剥夺条件:进程已获得的资源,在末使用完之前,不能强行剥夺。
循环等待条件:若干进程之间形成一种头尾相接的循环等待资源关系。
这四个条件是死锁的必要条件,只要系统发生死锁,这些条件必然成立,而只要上述条件之一不满足,就不会发生死锁。对于线程同步问题,有了进一步的理解:详见我写的关于多线程同步的文章(已作修改):http://blog.csdn.net/yjgx007/archive/2004/09/04/94559.aspx,主线程A等待另一个线程B的完成才能继续,在线程B中又要更新主线程A的界面,这里涉及了同步问题以及由此可能产生的死锁问题,同步问题在修改后的文章中讲得比较清楚了,对于线程之间可能产生死锁的浅析如下:
在等待线程B中更新主线程A的界面,如果未能正确处理A,B两线程同步的问题,极有可能导致两线程间的死锁,看下面代码:
UINT CMsiTestDlg::UpdateDeviceContent(LPVOID pParam)
{
CMsiTestDlg* pDlg = (CMsiTestDlg*)pParam;
int i = 0;
do {
pDlg->m_progress.SetPos(i); // 更新线程A中的进度条
Sleep(500);
} while(i++<10);return 0;
}void CMsiTestDlg::OnButton1()
{
MSG msg;
CWinThread* m_pUpdateThread = AfxBeginThread(UpdateDeviceContent, (LPVOID)this/*, THREAD_PRIORITY_BELOW_NORMAL*/);
if (m_pUpdateThread)
{
while (::WaitForSingleObject(m_pUpdateThread->m_hThread, INFINITE) != WAIT_OBJECT_0) //开始等待线程B至结束(线程结束时将返回WAIT_OBJECT_0)
PeekMessage(&msg, NULL, NULL, NULL, PM_REMOVE); //获取当前线程消息(可能是A线程也可能是B线程)并将消息从消息队列中移除
DispatchMessage(&msg); // 重新分发消息
...
}MessageBox("Thread is end!");
}m_pUpdateThread->m_hThread是等待线程B,这样调用似乎没有什么问题,在VC++中跟踪到线程B的线程函数UpdateDeviceContent中的pDlg->m_progress.SetPos(i); 时,发现程序不能继续执行,表现为在线程B中对主线程A的界面更新发生了阻塞(这里暂不考虑界面线程,权当由主线程处理),为何?原因就在于WaitForSingleObject(m_pUpdateThread->m_hThread, INFINITE)最后一个参数INFINITE - 无限期等待线程B的结束返回,从而产生了不幸:
线程A对线程B无限期等待造成未能重新分发消息(包括界面重绘WM_PAINT, 定时WM_TIMER以及硬件输入和系统消息,就里特指WM_PAINT消息),造成线程B的阻塞,线程B的阻塞又造成线程A的进一步等待造成线程A的阻塞,这就导致了死锁。
解决方法是:设置WaitForSingleObject的等待时间为一定值,如500毫秒,这样,线程A如若等不到线程B的结束,也会返回,并分发消息,使得线程B的执行得以正常继续,从而也就保证了线程A和线程B之间的正常同步!
-
性能响应时间(response time --RT)的2-5-8原则
2009-11-12 10:16:46
所谓的“2-5-8原则”,简单说,就是当用户能够在2秒以内得到响应时,会感觉系统的响应很快;当用户在2-5秒之间得到响应时,会感觉系统的响应速度还可以;当用户在5-8秒以内得到响应时,会感觉系统的响应速度很慢,但是还可以接受;而当用户在超过8秒后仍然无法得到响应时,会感觉系统糟透了,或者认为系统已经失去响应,而选择离开这个Web站点,或者发起第二次请求。 -
如何解决虚拟内存小的问题
2008-06-02 17:50:12
虚拟内存,并不是实际的内存,只是硬盘上的一块空间,把它来当实际内存使用。所以叫“虚拟内存”。
WINDWOS 为了解决内存不足的问题,采用了把硬盘剩余空间的中的一部分来模拟内存使用的技术,当实际内存不够用了,就把硬盘这块地方当内存用。开辟这块区域作内存使用的时候,确定这个区域的大小,通常是WINDOWS 检测硬盘总可用空间,然后按百分比划分出来一块区域。推荐你还是让 WINDOWS 自己来管理它确定它的大小。人为确定如果划分大了,浪费硬盘空间,划分小了,又不够用。
如果在装机时 WINDOWS 允许你使用最大 1536M 作为虚拟内存,说明你原来的盘上剩余可用空间至少应该有 5G,或者更多。你可以看看你现在的系统盘,也就是 C 盘,还有多少剩余空间。估计,是随着使用时间的延长,你的 C 盘剩余空间小了,所以系统给你划分出来用于虚拟内存的那块区域就小了,不够用了。
解决的办法,一个比较好的办法,是删除 C 盘上多余的文件,腾出更多的可用空间。
另一个办法,就是让 WINDOWS 把这个虚拟内存用的区域移到 D 盘上去。
如果你的 C 盘,可以移出去一部分数据到别的盘上,那么采用扩大 C 盘可用空间的办法,还是合适的。
如果你的 C 盘再没办法腾出可用空间的话,那就按以下办法,把它改到 D 盘上去:1、右键单击“我的电脑”——“属性”——“高级”页——“性能”栏——设置
2、“性能选项”对话框——“高级”页——“虚拟内存栏”——更改
3、根据自己实际调整一下虚拟内存吧。将系统管理改为自定义
建议:(1)把虚拟内存设置在系统分区以外的分区,例如系统在C:\,那虚拟内存就设置在D:\
(2)“初始大小”一般为物理内存的2倍,“最大值”一般为4倍(系统默认分别为1.5和3)(也可以都设为一样的,如700mb)
(3)设置好,一定要点击“设置”,否则设置无效。
(4)、确定
4、重启计算机生效;
-
如何在DB2 UDB中正确的监控死锁-----转赛迪网
2008-06-02 17:34:12
第一章 常用术语、事件监控器引:这篇文章通过详细的实例阐述了如何在DB2 UDB 中监控死锁的发生。在DB2 UDB中有两种类型的监控器:快照监控器和事件监控器。快照顾名思义就是数据库连续状态下的一个切面,通过快照监控器,你可以很方便地查看当前连接的应用程序,
前言:这篇文章通过详细的实例阐述了如何在DB2 UDB 中监控死锁的发生。在DB2 UDB中有两种类型的监控器:快照监控器和事件监控器。快照顾名思义就是数据库连续状态下的一个切面,通过快照监控器,你可以很方便地查看当前连接的应用程序,当前等待的锁,当前的死锁,以及正在执行的SQL语句,同时你可以查看缓冲区,表和表空间的用法。如果保存历史数据,并且能够做出比较,对于分析数据库的并发性能有很大的帮助。
但是我们并不能预测什么时候发生死锁,所以如果有一个后台程序能够一直监控数据库的活动,记录下所有的死锁事件,这对于数据库管理员来说是非常重要的。DB2 UDB提供了事件监控器。通过不遗漏地获得一段时间内所有的数据库事件(在本文中只关心其中的死锁事件),事件监控器提供了一种可以分析历史数据(本文的重点),预测将来趋势的可能。DB2 UDB同时提供了DB2 Performance Expert (DB2/PE) 或者类似的程序用来生成分析报表,不过这已经超出了本文的范畴。
常用术语
锁是控制应用程序并发的数据库软件机制,锁用来防止以下情况的发生:
1. 丢失以前更新
2. 不可重复读取
3. 访问未提交数据
锁的模式包括共享锁和排他锁,共享锁允许其他程序读取已经被其他共享锁占用的资源,所以也叫读锁,排他锁意味着在释放资源以前其他的应用程序无法访问同一资源,所以也叫写锁。此外,DB2 UDB 还提供了不同的锁级别,不同的应用程序可能会要求访问不同范围的数据,锁级别有利于充分利用系统资源,提高系统性能。若一个应用程序请求一个锁,而该锁被另外一个应用程序所使用且不能共享,DB2 UDB 就会挂起前一个应用程序。锁升级就是当LOCKLIST (LOCKLIST代表锁能够占用的内存空间) 耗尽或者一个应用程序所拥有的锁大于MAXLOCKS*LOCKLIST的时候(MAXLOCKS 代表应用程序所拥有的锁占所空间的百分比),DB2 UDB 就试图把几个行级别的锁合并为一个表级别的锁,从而释放锁空间。虽然锁升级本身并不耗费多少时间,但是锁住整个表通常会大大地降低并发性能。
当应用程序处于挂起状态超过了一段规定的时间后,DB2 UDB就会自动中止这个应用程序,同时会向SQLCA发送描述性的错误信息。当两个或者更多的应用程序都持有另外一个应用程序所需资源上的锁,没有这些资源,那些应用程序都无法继续完成其工作的时候,就会发生死锁。
在DLCHKTIME超时之后,DB2 UDB会中止发生死锁的某个应用程序(通常为所做工作最少的那个应用程序),这会释放这个应用程序所持有的所有的锁,并允许别的应用程序继续工作,DB2 UDB 将向被终止的应用程序的SQLCA发送描述性的错误信息。LOCKTIMEOUT 指定一个应用程序被允许的锁等待的时间,这将避免全局的死锁从而导致整个应用崩溃。如果LOCKTIMEOUT 的值为-1,应用程序会等待直到该锁被释放或者发生一个死锁。
事件监控器
事件监控器用来收集当一个数据库事件发生时所关联的应用程序的信息。这里的事件指,连接,死锁,声明和事务。你可以定义你想监控的事件类型的监控器。比如说,一个死锁监控器就是用来监控死锁的发生。
在DB2 UDB 中存在两种和死锁有关的事件类型:
DEADLOCKS
记录简单的应用程序信息。
DEADLOCKS WITH DETAILS
记录所有复杂的信息,包括应用程序、执行语句声明以及死锁的详细信息。但是使用这种事件监控器会因为需要得到大量额外的信息而降低系统的性能。
第二章 如何监控死锁为了详细说明事件监控器在死锁监控中的用途,我引入了一个简单的死锁场景来触发一个死锁,在随后的章节,我会告诉读者如何分析监控结果以及根据结果来避免死锁的发生。
这里我们需要至少三个应用程序来调用DB2 CLI,一个用来监控死锁的发生,另外两个用来产生死锁。我们可以使用DB2 UDB 安装时附带的SAMPLE数据库。
1. 首先建立一个死锁事件监控器
Session Monitor
db2 connect to sampledb2 "create event monitor
dlmon for tables, deadlocks with details write
to file 'C:\dlmon'"mkdir C:\dlmondb2 "
set event monitor dlmon state 1"
2. 用另外两个应用程序来产生一个死锁
Session A
db2 connect to sampledb2 +c "insert into employee values('000350', 'Truman', 'I', 'Jiang',
'B00', '5892','1999-02-21', 'Engineer', 19, 'M',
'1978-06-17', 60000, 2000, 6000)"
现在应用程序A就拥有了一个EMPLOYEE表的行级别的排他锁
(注: +c 代表不自动提交SQL语句,DB2 中 autocommit 是缺省设置,也可以通过 db2 update command options using c off 关闭该缺省选项。)
Session B
db2 connect to sampledb2 +c "insert into project
values('AD3300', 'Dead Lock Monitor', 'B00', '000350',
7.00, '1982-07-21', '1983-02-03', 'AD3111')"
现在应用程序B就拥有了一个PROJECT表的行级别的排他锁
Session A
db2 +c "select projname from project"
应用程序A需要PROJECT表上所有行的共享锁,但是因为PROJECT表正在被应用程序B以排他锁的形式独占,这时候应用程序1就进入一个锁等待的状态。
Session B
db2 +c "select firstnme from employee"
应用程序B也进入一个锁等待的状态。此时就出现了一个死锁状态。
3. 两个本身处于锁等待并且占有资源的应用程序互相等待另外一方所持有的资源,这时候Session A和Session B就出现了死锁状态,这种状态一直会延续直到死锁检查器(超出DLCHKTIME时间以后)检查出一个死锁并且回滚其中的一个事务。
Session B
SQLN0991N 因为死锁或者超时,当前事务已经被回滚。原因码为 "2". SQLSTATE=40001这时候死锁事件监控器就会记录这个死锁,同时应用程序A可以完成他的工作。
Session A
PROJNAME----------……20 条记录已选择
Session A
db2 connect reset
Session B
db2 connect reset
4. 通过 db2evmon 工具可以获得死锁信息的日志,并且把日志文件导入到本地机器的文件系统当中。在下面一节,我们将详细分析导出的日志文件。
Session Monitordb2 connect resetdb2evmon
-path c:\dlmon > c:\dlmon\dllog1.txt
分析监控结果本节我们开始详细分析上一节产生的监控结果,从监控导出的日志文件中,我们可以分析出死锁发生的时间,级别,模式以及产生死锁的SQL语句,从而据此来进一步地修正可能由程序并发设计或者数据库设计所导致的缺陷。
---------------------------------
EVENT LOG HEADER Event Monitor name:
DLMON Server Product ID: SQL08022…… Server instance name: DB2
--------------------------------------
--------------------------------------
Database Name: SAMPLE Database Path:
C:\DB2\NODE0000\SQL00001\ ……------------------3)
Deadlock Event ... Deadlock ID: 1 ……4)
Connection Header Event ... Appl Handle: 949 ……5)
Deadlocked Connection ... Deadlock ID:
1 Participant no.:
2 Participant no. holding the lock: 1 Appl Id:
G9B56A72.HE13.01B406083205 Appl Seq number: 0001
Appl Id of connection holding the lock:
G9B56A72.HD13.02CE06083152 …… Deadlock detection
time: 2006-01-06 16:34:27.327582 Table of lock waited on:
EMPLOYEE (A锁发生的表) Schema of lock waited on:
JT Tablespace of lock waited on : USERSPACE1
Type of lock: Row (A锁级别为行锁) Mode of lock:
X - Exclusive (A锁模式为排他锁) Mode application
requested on lock: NS - Share (and Next Key Share)
(在A排他锁上要求B共享锁,发生死锁) ……Text:
select name from employee(产生B共享锁的SQL语句)
List of Locks: (当前所有锁的列表)…… Lock Name
: 0x020005000D0000000000000052 Lock Attributes: 0x00000008
Release Flags : 0x40000000 Lock Count
: 1 Hold Count : 0 Lock Object Name
: 13 Object Type : Row Tablespace Name: USERSPACE1
Table Schema : JT Table Name
: PROJECT Mode : X - Exclusive
(在PROJECT表上有一个排他锁)…… Lock Name:
0x02000300000000000000000054 Lock Attributes:
0x00000000 Release Flags: 0x00000001 Lock Count
: 1 Hold Count : 0
Lock Object Name : 3 Object Type:
Table Tablespace Name: USERSPACE1 Table Schema:
JT Table Name: EMPLOYEE Mode
: IS - Intent Share(在EMPLOYEE表上有一个共享锁)
Locks Held: 6 Locks in List: 6……9) Table Event...
Table schema: JT Table name: EMPLOYEE Record
is the result of a flush: FALSE Table type: User
Data object pages: 1…… Rows read: 35 Rows written:
1 …… Tablespace id: 2 Table event timestamp:
2006-01-06 16:37:28.972501 (记录EMPLOYEE表上发生的事件)
我们可以分析一下dllog1.txt 文件,来准确定位死锁发生的原因,看看5)Deadlocked Connection: 我们可以看出死锁发生的表是EMPLOYEE,同时我们也可以判断出这是一个对于已被排他锁占有的资源申请共享锁所导致的死锁。更加重要的是我们得到了产生死锁的SQL语句,从上面我们可以推断出一定存在别的应用程序在以独占锁的方式占用EMPLOYEE表,这很有可能就是对于EMPLOYEE表的插入或者更新动作造成的。
而这最有可能就是插入或者更新事务时间过长所导致的,导致事务时间过长的原因大体有两种,一是来自于并发程序的设计和编写,二是来自于数据库的设计和数据库参数的调整。
本节我们通过仔细地分析事件监控器的结果来推断出导致死锁发生的原因,从而采取有效的措施去避免死锁的发生。这些措施包括调整数据库参数,或者修改应用程序的代码,或者修改SQL语句甚至是数据库的设计来提高代码和SQL语句执行的效率。
第三章 避免死锁的方法
越早地考虑数据库设计中的并发性问题,就越可以提高代码执行的效率,降低程序开发和维护的成本,这里我们提出了一些避免死锁,提高应用程序并发性的方法。
设置隔离级别,根据应用程序的业务逻辑和数据完整性需求来决定合适的隔离级别,包括:RR,RS,CS,UR。该决定需要对应用程序需求和相关的业务规则具有基本理解
尽量避免锁升级,正确调整参数LOCKLIST, MAXLOCKS
SQL0911N返回码68(LOCKTIMEOUT参数)的原因是锁等待超时,而SQL0911返回码2(DLCHKTIME参数)的原因则是因为死锁被强制回滚,避免这两种错误的方法就是合理设计数据库和建立合理的索引
尽快提交事务,不要在事务中加入不必要的执行时间过长的代码,比如大的代码循环和远程调用,或者一些没有用处的SELECT语句
应用程序的框架实现保证一旦发现SQL错误,立刻执行回滚事务,释放锁。
如果多个应用程序访问同一资源,最好以相同的次序访问。这样,即使前一个访问资源的应用程序会延迟其他应用程序的访问,也不会导致死锁的发生
设定外键索引,如果想删除父表中的行,就需要扫描多个子表中的多行数据,这样就需要占用多个子表的锁,我们可以通过在外键上建立索引来减少扫描子表的行数,否则若不建立索引,如果从父表中删除一行的时候,就需要扫描整个子表。
总结
在我门完成这个例子的实际过程中,大家可以看到不同DB2工具(DBC CLI, SQL, DB2EVMON)的使用实例,并且可以学会如何逐步地利用死锁事件监控器来监控死锁的发生,最后我门掌握的内容是如何分析那些从死锁监控器得来的结果,以及采用相应的措施来避免死锁的发生。
-
WebLogic Server 性能调优----转载
2008-06-02 17:31:24
本文针对WebLogic讨论了其中的某些调试参数,不过并未将所有可调整的属性全部列出。此外,在将此处推荐的方法运用到产品环境之前,建议您先在测试环境中对它们测试一番。
性能监控及瓶颈发现
性能调试的第一步是孤立“危险区域”。性能瓶颈可以存在于整个系统的任一部分――网络、数据库、客户端或应用服务器。重要的是首先确定哪个系统组件引起了性能问题,调试错了组件可能会使情况更糟。
WebLogic Server为系统管理员提供了管理控制台和命令行工具两种方式监控系统性能。服务器端有叫作mbean的集合,用于搜集诸如线程消耗情况、资源剩余情况、缓存使用情况等信息。控制台和命令行管理器都可以从服务器将这些信息调用出来。图1的屏幕快照就显示了EJB容器中缓存的使用和剩余情况,这是控制台提供的性能监控的选项之一。
代码分析器也是应用代码用以探测自身性能瓶颈的另一种有效的工具。有几个很好的代码分析器,如:Wily Introscope, Jprobe, Optimizelt。
EJB 容器
EJB容器中最昂贵的操作当然是数据库调用――装载和存储实体bean。容器也因此提供了各种各样的参数以便减少数据库的访问次数。但不管怎样,除非是在特殊情况下,否则在每个bean的每次交易中,至少都得有一次装载操作和一次存储操作。这些特殊情况是:
1. Bean是只读的。此时,bean只需在第一次访问时装载一次,从来不需要存储操作。当然,如果超出参数read-timeout-seconds的设置,bean将被再次装载。2. Bean 有专门的或积极的并发策略,且参数db-is-shared 设置为假。此参数在WebLogic Server 7.0中被重新命名为cache-between-transactions。参数db-is-shared 设置为假相当于参数cache-between-transactions设置为真。
3. Bean在交易中未被修改过,此时,容器会将存储操作优化掉。
如果不属于上述任何一种情况,则code path中的每个实体bean在每次交易时,至少会被装载和存储一次。有些特征能够减少数据库的调用或者降低数据库调用的开销,如:高速缓存技术、域(field)分组、并发策略以及紧密关联缓存(eager relationship caching)等,其中的某些特征是WebLogic Server 7.0新增的。
高速缓存:实体bean缓存空间的大小由weblogic-ejb-jar.xml中的参数max-beans-in-cache定义。容器在交易中第一次装载bean时是从数据库调用的,此时bean也被放在缓存中。如果缓存的空间太小,有些bean就被滞留在数据库中。这样,如果不考虑前面提到的前两种特殊情况的话,这些bean在下次调用时就必须重新从数据库装载。从缓存调用bean也意味着此时不必调用setEntityContext()。如果bean的关键(主)键是组合域或者比较复杂,也能省却设置它们的时间。域分组:域分组是对于查找方法指定从数据库加载的域。如果实体bean与一个较大的BLOB域(比方说,一幅图像)相联系,且很少被访问,则可以定义一个将此域排除在外的域组,该域组与一个查找方法相关联,这样查找时,BLOB域即不会被装载。这种特征只对EJB2.0的bean 适用。
并发策略:在WebLogic Server 7.0中,容器提供了四种并发控制机制。它们是独占式、数据库式、积极式和只读式。并发策略与交易进行时的隔离级别紧密相关。并发控制并不是真正意义上的提高性能的措施,它的主要目的是确保实体bean所表示的数据的一致性,该一致性由bean的部署器所强制要求。无论如何,某些控制机制使得容器处理请求的速度比其它的要快一些,但这种快速是以牺牲数据的一致性为代价的。
最严格的并发策略是独占式,利用特殊主键对bean的访问是经过系列化的,因此每次只能有一个交易对bean进行访问。这虽然在容器内提供了很好的并发控制,但性能受到限制。在交易之间允许互为缓存的时候,这种方法很有用,但在集群环境中不能使用,此时,装载操作被优化掉,因此可能导致丧失并行性。数据库式的并发策略不同于数据库的并发控制。实体bean在容器中并未被锁定,允许多个交易对相同的实体bean并发操作,因此能够提高性能。当然,这样对隔离的级别也许要求较高,以便确保数据的一致性。
积极式并发策略与数据库的并发控制也不同。不同之处在于对数据一致性的检查发生在对已设定的更新操作进行存储时而非在装载时将整行锁定。如果应用内对同一个bean访问的冲突不是很激烈的情况下,本策略比数据库式的策略要快一些,虽然两个提供了相同的数据一致性保护级别。但是在有冲突发生的时候,本策略要求调用者要重新发起调用。 本特征也只对EJB 2.0 适用。
只读式策略只能用于只读bean。Bean只在应用第一次访问时或者超出参数read-timeout-seconds所指定的值时才被装载。Bean从来不需要被存储。当基本数据改变时,也会通过read-mostly格式通知bean,从而引起重新装载。
紧密关联缓存: 如果两个实体bean, bean A 和bean B 在CMR(容器关系管理)内关联,两个在同一个交易中被访问,且由同样的数据库调用装载,我们称为紧密关联缓存。这是WebLogic Server 7.0的新特征,同样只适用于EJB2.0。除了上面列出的通过优化容器内对数据库的访问从而达到性能增加的特征外,另有一些在容器之外,针对会话bean和实体bean的参数能够帮助提升性能。
缓冲池和高速缓存是EJB容器为提高会话bean和实体bean性能所提供的主要特征。然而,这些方法并非对所有类型的bean适用。它们的消极面是对内存要求较高,虽然这不是主要的问题。缓冲池适用于无状态会话bean(SLSB),消息驱动bean(MDB)以及实体bean。一旦为SLSB和MDB设定了缓冲池的大小,这些bean的许多实例就会被创建并被放到缓冲池中,setSessionContext()/setMessageDriveContext()方法会被调用。为这些bean设置的缓冲池的大小不必超过所配置的执行线程数(事实上,要求比此数要小)。如果方法setSessionContext()要做任何开销昂贵的操作的话,此时JNDI查询已经完成,使用缓冲池中的实例方法调用将会加快速度。对实体bean来说,在完成setEntityContext()方法调用之后,缓冲池与bean的匿名实例相连(没有主键)。这些实例可以被查询操作所使用,查询方法从缓冲池中取出一个实例,为其指定一个主键,然后从数据库中装载相应的bean。
高速缓存适用于有状态会话bean(SFSB)和实体bean。实体bean已经在前面讨论过。对于SFSB,缓存能够避免向硬盘串行化的操作。串行化到硬盘的操作非常昂贵,绝对应该避免。用于SFSB的缓存大小可以比连接到服务器的并发客户端数略微大些,这是由于仅当缓存被占用了85%以后,容器才会设法将bean滞留在数据库中待命。如果缓存大于实际所需,则容器不会通过缓存花费时间将bean待命。
EJB容器提供了两种方法进行bean-to-bean 和 Web-tier-to-bean的调用操作:传值调用和传送地址调用。如果bean处在同一个应用之中,则缺省情况下,用的是传送地址的方法,这比传值要快一些。传送地址的方法一般不应被禁止,除非有充足的理由要强制这样做。强制使用传送地址的另一种做法是使用本地接口。在WebLogic Server 7.0中引入了另一个特征是对有状态服务使用激活(activation)。虽然这种做法在某种程度上影响了性能,但由于对内存要求较低,因此极大地改进了扩展性。如果扩展性不值得关注,可以将参数noObjectAction传送给ejbc从而关闭激活(activation)。
JDBC
对数据库的访问来说,调试JDBC与调试EJB容器同样重要。比方说设置连接池的大小――连接池应大到足以容纳所有线程对连接的要求。如果所有对数据库的访问能够在缺省的执行队列中得以实现,则连接数应为执行队列中的线程数,比读取socket的线程(缺省执行队列中用来读取进入请求的线程)数要少。为了避免在运行期间对连接进行创建和删除,可在初始时即将连接池设置为其最大容量。如果可能的话,应确保参数TestConnectionsOnReserve被设置为假(false,这是缺省设置)。如果此参数设置为真(true),则在连接被分配给调用者之前,都要经过测试,这会额外要求与数据库的反复连接。
另一个重要的参数是PreparedStatementCacheSize。每个连接都为宏语句设一个静态的缓存,大小由JDBC连接池配置时指定。缓存是静态的,时刻牢记这一点非常重要。这意味着如果缓存的大小是n的话,则只有放在缓存中的前n条语句得到执行。确保昂贵的SQL语句享受到缓存的方法是用一个启动类将这些语句存放到缓存中。尽管缓存技术从很大程度上改进了性能,但也不能盲目使用它。如果数据库的格式有了变化,那么在不重新启动服务器的情况下,无法使缓存中的语句失效或者是用新的进行替换。当然,缓存中的语句会使数据库中的光标得以保留。
对于WebLogic Server 7.0来说,由于jDriver性能的改进已使其速度远远快于Oracle的廋驱动程序,尤其对于要完成大量SELECT操作的应用来说就更是如此。这可以从HP提交的利用WebLogic Server 7.0 Beta版的两份Ecperf结果得到证明(http://ecperf.theserverside.com/ecperf/index.jsp?page=results/top_ten_price_performance)。
JMS
JMS子系统提供了很多的调试参数。JMS消息是由称为JMSDispatcher的独立执行队列处理的。因此,JMS子系统既不会由于运行在缺省或者其它执行队列中的应用因争夺资源而导致“营养匮乏”,反过来也不会抢夺其它应用的资源。对JMS来说,大多数的调试参数都是在服务的质量上进行折衷处理。如,利用文件式持续性目的地(file-persistent destnation)禁止同步写操作(通过设置特性: -Dweblogic.JMSFileStore.SynchronousWritesEnabled =false)以后会引起性能急剧提高,但同时也会冒着丢失消息或者重复接收消息的风险。类似地,利用多点传送发送消息会提升性能,同时也会有消息半途丢失的危险。
消息确认间隔不应设置得过短――发送确认的比率越大,处理消息的速度可能会越慢。同时,如果设置得过大,则意味着系统发生故障时,消息会丢失或者被重复发送。
一般说来,应在单个服务器上对多个JMS目的地进行配置,而不是将它们分散在多个JMS服务器,除非不再需要扩展。
关闭消息页面调度(paging)可能会提高性能,但会影响可扩展性。如果打开消息页面调度(paging),则需要额外的I/O操作以便将消息串行化到硬盘,在必要的时候再读进来,但同时也降低了对内存的要求。
一般来说,异步过程比同步过程更好操作,更易于调节。
Web容器
Web层在应用中更多的是用来生成表达逻辑。广泛使用的体系结构是从应用层读取数据,然后使用servlet和JSP生成动态内容,其中应用层一般由EJB组成。在这种结构中,servlet 和JSP保留对EJB的引用,以防它们与数据库或数据源直接对话。将这些引用保存起来是个不错的主意。如果JSP和servlet没有和EJB部署在同一台应用服务器上,则利用JNDI进行查询的费用是很昂贵的。
JSP缓存标记符可以用于存储JSP页面内的数据。这些标记符都支持对缓存的输入和输出。对缓存的输出涉及到标记符内的代码所生成的内容,对缓存的输入涉及到标记符内的代码对变量的赋值。如果不希望Web层频繁变化,则可以通过将ServletReloadCheckSecs 设置为-1,从而关闭自动装载(auto-reloading)功能。使用这种方法以后,服务器将不再轮询Web层是否有变化,如果JSP和servlet的数量很多,则效果是非常明显的。
这里也建议不要在HTTP会话中储存过多的信息。如果信息是必须的,可以考虑使用有状态会话bean来替代。
JVM调试
如今的大多数JVM具有自主调节功能,因为它们能够探测到代码中的危险区域并对它们进行优化。开发和部署人员能够考虑的调试参数大概就是堆设置了。设置这些并没有一般的规则。JVM一般堆空间,按新空间或保留空间一般设置为整个堆空间的三分之一或一半组织。整个堆空间不能指定得过大以致于无法支持并发的内存垃圾回收(GC)处理。在这种设置环境中,如果堆太大的话,垃圾回收的间隔应设为一分钟或更长。最后,需要引起注意的是这些设置在很大程度上依赖于部署在服务器上的应用使用内存的模式。有关调试JVM的其它信息可以参考:
http://edocs.bea.com/wls/docs70/perform/JVMTuning.html1104200。
服务器调试
除了由各个子系统提供的调试参数以外,还有适用于服务器的参数能够帮助提升性能。其中最重要的是配置线程数和执行队列数。增加线程数并非总能奏效,仅当下列情况成立时再考虑使用这种方法:预定的吞吐量没有达到;等待队列(未开始处理的请求)过长;CPU仍有剩余。当然,这样做并不一定能改善性能。CPU使用率低可能是由于对服务器的其它资源竞争所致,如,没有足够的JDBC连接。当改变线程数时应考虑到这些类似的因素。
在WebLogic Server 7.0中,提供了配置多个执行队列的功能,并且能够在部署中定义处理特殊的EJB或JSP/servlet请求的执行队列。要做到这些,只要在运行weblogic.ejbc时将标志 -dispatchPolicy <队列名称> 传送给bean 即可。对于JSP/servlet,可将设置Web应用的weblogic部署描述符中初始化参数(init-param) wl-dispatch-policy的值设为执行队列的名字即可。有时应用中的某些bean/JSP对操作的响应时间比其它的要长,此时,可以对这些bean/JSP设置单独的执行队列。至于队列的大小,要达到最好的性能,还取决于经验。
另一个比较大的问题是决定在何种情况下应该使用WebLogic性能包(http://e-docs.bea.com/wls/docs70/perform/WLSTuning.html - 1112119)。如果socket数不太多(每个服务器上都有一个socket用于客户端JVM的远程方法调用连接),而且总是忙于读取从客户端发送过来的请求数据,那么此时使用性能包恐怕不会有明显的改进。也有可能不用性能包会导致相似或更好的结果,这取决于JVM在处理网络I/O时的具体实现。
Socket读取线程取自缺省执行队列。在Windows 环境下,每个CPU有两个socket读取线程,在solaris环境下,共有三个socket用于本地输入输出(native I/O)。对于Java 输入输出(I/O),读取线程数由配置文件config.xml中的参数PercentSocketReaderThreads 进行设置。它的缺省值是33%, 上限是50%,这是显而易见的,因为如果没有线程用于处理请求,则同样不会有更多的读取线程啦。对于Java I/O,应使读取线程数尽量接近客户端连接数,因为在等待请求时,Java I/O会阻塞。这也是为什么当客户端的连接数增加时,线程数不能一直同等增加的原因。
结论
我们上面只讨论了调试服务器的部分方法。需要记住的是,一个设计蹩脚,编写欠佳的应用,通常都不会有好的性能表现,无论对服务器及其参数如何调试。贯穿应用开发周期的各个阶段――从设计到部署,性能始终应该是考虑的关键因素。经常发生的情况是性能被放在了功能之后,等到发现了问题再去修改,已经很困难了。有关WebLogic Server 性能调试的其它信息可以参考:http://e-docs.bea.com/wls/docs70/perform/index.html。
-
DB2性能调优的10大技巧----转载
2008-06-02 17:26:32
DB2 perfomance tuning
Writer Intr:Scott Hayes is president of Database-Guys Inc., a performance tools and consulting company specializing in DB2 UDB on Unix platforms. He is also a member of the IBM DB2 Gold Consultant Group and a DB2 UDB Advanced Certified Technical Expert. Scott has worked with DB2/AIX since V1, and his diverse experiences have taught him a number of DB2 UDB best practices. A frequent speaker at IDUG and DB2 technical conferences, Scott has published a number of articles in DB2-related magazines.
Database performance woes? Don't panic. This database first-aid plan will help you find and repair almost any performance problem.
The Top 10 At A Glance
1. Use sufficient agents for the workload.2. Do not allow DB2 to needlessly close and open files.
3. Do not allow extended lock waits.
4. Ensure parallel I/O capabilities to the database TEMPSPACE tablespace.
5. Manage DB2 sort memory conservatively and don't mask sort problems with large SORTHEAP s.
6. Analyze table access activity and identify tables with unusually high rows read per transaction or overflow counts.
7. Analyze the performance characteristics of each tablespace, and seek to improve the performance of the tablespaces with the slowest read times, longest write times, highest physical I/O read rates, worst hit ratios, and access attributes that are inconsistent with expectations.
8. Create multiple buffer pools, and make purposeful assignments of tablespaces to buffer pools such that access attributes are shared.
9. Examine DB2 UDB SQL Event Monitor information to discover which SQL statements are consuming the largest proportions of computing resources, and take corrective actions.
10. Reevaluate configuration and physical design settings once high cost SQL is eliminated.
--------------------------------------------------------------------------------
Every few weeks or so, we get performance calls from DBAs in distress. "Our Web site is crawling," they bemoan. "We're losing customers, and the situation is dire. Can you help?" To answer these calls, I've developed an analytics process for my consulting company that lets us rapidly find the cause of performance problems and develop remedial actions and tuning suggestions. Rarely do these callers inquire about fees or costs - they're only interested in stopping the bleeding. When a DB2 or e-business application isn't performing up to expectations, the entire organization and financial bottom line measurably suffers.
To help DB2 DBAs avoid performance fires and achieve high performance on their own, I've summarized a troubleshooting process for our clients, customers, and fellow DB2 professionals. The top 10 performance tips for e-business OLTP applications in DB2 UDB for Unix, Windows, and OS/2 environments are:10. Monitor Switches
Make sure the monitor switches are turned on. If they aren't, you won't have access to the performance information you need. To turn the monitor switches on, issue the command:db2 "update monitor switches using
lock ON sort ON bufferpool ON uow ON
table ON statement ON"
9. Agents
Make sure there are enough DB2 agents to handle the workload. To find out, issue the commanddb2 "get snapshot for database manager"
and look for the following lines:High water mark for agents registered = 7
High water mark for agents
waiting for a token = 0
Agents registered= 7
Agents waiting for a token= 0
Idle
agents= 5
Agents assigned from pool= 158
Agents created from empty Pool = 7
Agents stolen from another application= 0
High water mark for coordinating agents= 7
Max agents ōverflow= 0
If you find either Agents waiting for a token or Agents stolen from another application , increase the number of agents available to the database manager ( MAXAGENTS and/or MAX_COORDAGENTS as appropriate).8. Maximum Open Files
DB2 tries to be a good citizen within the constraints of operating system resources. One of its "good citizen" acts is putting a ceiling, or upper limit, on the maximum number of files open at any one time. The MAXFILOP database configuration parameter stipulates the maximum number of files that DB2 can have open concurrently. After it reaches that point, DB2 will start closing and opening its tablespace files (including raw devices). Opening and closing files slows SQL response times and burns CPU cycles. To find out if DB2 is closing files, issue the commanddb2 "get snapshot for database on DBNAME"
and look for the line that reads:Database files closed = 0
If files are being closed, increase the value of MAXFILOP until the opening and closing stops. Use the command:db2 "update db cfg for DBNAME using MAXFILOP N"
7. Locks
The default value for LOCKTIMEOUT is -1 , which means that there will be no lock timeouts - a situation that can be catastrophic for OLTP applications. Nevertheless, I all too frequently find many DB2 users with LOCKTIMEOUT = -1 . Set LOCKTIMEOUT to a very short value, such as 10 or 15 seconds. Waiting on locks for extended periods of time can have an avalanche effect on locks.First, check the value of LOCKTIMEOUT with this command
db2 "get db cfg for DBNAME"
and look for the line containing this text:Lock timeout (sec) (LOCKTIMEOUT) = -1
If the value is -1 , consider changing it to 15 seconds by using the following command (be sure to consult with the application developers or your vendor first to make sure the application is prepared to handle lock timeouts):db2 "update db cfg for DBNAME using LOCKTIMEOUT 15"
You should also monitor the number of lock waits, lock wait time, and amount of lock list memory in use. Issue the command:db2 "get snapshot for database on DBNAME"
Look for the following lines:Locks held currently= 0
Lock waits= 0
Time database waited on locks (ms)= 0
Lock list memory in use (Bytes)= 576
Deadlocks detected= 0
Lock escalations= 0
Exclusive lock escalations= 0
Agents currently waiting on locks= 0
Lock Timeouts= 0
If the Lock list memory in use (Bytes) exceeds 50 percent of the defined LOCKLIST size, then increase the number of 4K pages in the LOCKLIST database configuration.6. Temporary Tablespaces
Temporary tablespaces should have at least three containers on three different disk drives in order to help DB2 perform parallel I/O and improve performance for sorts, hash joins, and other database activities that use TEMPSPACE .To find out how many containers your temporary tablespace has, issue the command:
db2 "list tablespaces show detail"
Look for the TEMPSPACE tablespace definition similar to this example:Tablespace ID= 1
Name= TEMPSPACE1
Type= System managed space
Contents= Temporary data
State= 0x0000
Detailed explanation: Normal
Total pages= 1
Useable pages= 1
Used pages= 1
Free pages= Not applicable
High water mark
(pages)= Not applicable
Page size (bytes)= 4096
Extent size (pages)= 32
Prefetch size (pages)= 96
Number of containers= 3
Notice that Number of containers has the value 3, and that Prefetch size is three times Extent size . For best parallel I/O performance, it is important for Prefetch size to be a multiple of Extent size . The multiple should be equal to the number of containers.
To find the definitions for the containers, issue the command:
db2 "list tablespace containers for 1 show detail"
The 1 refers to tablespace ID #1 , which is TEMPSPACE1 in the example just given.5. SORT MEMORY
OLTP applications should not be performing large sorts. They are too costly in terms of CPU, I/O, and elapsed time and will slow down any OLTP application. Therefore, the default SORTHEAP size of 256 4K pages (1MB) should be more than adequate. You should also know the number of sort overflows and the number of sorts per transaction.Issue the command
Db2 "get snapshot for database on DBNAME"
and look for the following lines:Total sort heap allocated= 0
Total sorts = 1
Total sort time (ms)= 8
Sort ōverflows = 0
Active sorts = 0
Commit statements attempted = 3
Rollback statements
attempted = 0
Let transactions = Commit statements attempted + Rollback statements
attempted
Let SortsPerTX= Total sorts / transactions
Let PercentSortOverflows = Sort overflows * 100 / Total sorts
If PercentSortOverflows ((Sort overflows * 100) / Total sorts ) is greater than 3 percent, there may be serious and unexpected sort problems in the application SQL. Because the very presence of overflows indicates that large sorts are occurring, finding zero sort overflows, or at least a percentage less than one, would be ideal.If excessive sort overflows are present, the "band aid" solution is to increase the size of SORTHEAP . However, doing so only masks the real performance problem. Instead, you should identify the SQL that is causing the sorts and change the SQL, indexes, or clustering to avoid or reduce the sort cost.
If SortsPerTX is greater than 5 (as a rule of thumb), the number of sorts per transaction may be high. Some application transactions perform dozens of small composite sorts (which do not overflow and have very short durations), but consume excessive CPU. When SortsPerTX is high, my experience indicates that these machines are typically CPU bound. Identifying the SQL that is causing the sorts and improving the access plans (via indexes, clustering, or SQL changes) is paramount to improving transaction throughput rates.
4. TABLE ACCESS
For each table, identify how many rows DB2 is reading for each transaction. You must issue two commands:1. db2 "get snapshot for database on DBNAME"
2. db2 "get snapshot for tables on DBNAME"
After you issue the first command, determine how many transactions have occurred (by taking the sum of Commit statements attempted plus Rollback statements attempted - see tip 3).
After issuing the second command, divide the number of rows read by the number of transactions ( RowsPerTX ). OLTP applications should typically read one to 20 rows from each table per transaction. If you discover that hundreds or thousands of rows are being read for each transaction, scans are taking place and indexes may need to be created. (Sometimes simply running runstats with distribution and detailed indexes all provides a cure.)
Sample output from "get snapshot for tables on DBNAME" follows:
Snapshot timestamp = 09-25-2000
4:47:09.970811
Database name= DGIDB
Database path= /fs/inst1/inst1/NODE0000/SQL00001/
Input database alias= DGIDB
Number of accessed tables= 8
Table List
Table Schema= INST1
Table Name= DGI_
SALES_ LOGS_TB
Table Type= User
Rows Written= 0
Rows Read= 98857
ōverflows= 0
Page Reorgs= 0
A high number of Overflows probably means you need to reorganize the table. Overflows occur when DB2 must locate a row on a suboptimal page due to a change in a row's width.3. TABLESPACE ANALYSIS
A tablespace snapshot can be extremely valuable to understanding what data is being accessed and how. To get one, issue the command:db2 "get snapshot for tablespaces on DBNAME"
For each tablespace, answer the following questions:What is the average read time (ms)?
What is the average write time (ms)?
What percentage of the physical I/O is asynchronous (prefetched) vs. synchronous (random)?
What are the buffer pool hit ratios for each tablespace?
How many physical pages are being read each minute?
How many physical and logical pages are being read for each transaction?For all tablespaces, answer the following questions:
Which tablespaces have the slowest read and write times? Why? Containers on slow disks? Are container sizes unequal?
Are the access attributes, asynchronous versus synchronous access, consistent with expectations? Randomly read tables should have randomly read tablespaces, meaning high synchronous read percentages, usually higher buffer pool hit ratios, and lower physical I/O rates.For each tablespace, make sure that the prefetch size is equal to the extent size multiplied by the number of containers. Issue the command:
db2 "list tablespaces show detail"
The prefetch size can be altered for a given tablespace if necessary. Container definitions can be checked by using the commanddb2 "list tablespace containers for N show detail"
in which N is the tablespace ID number.2. BUFFER POOL OPTIMIZATION
All too often I find DB2 UDB sites where the machines have 2, 4, or 8GB of memory, yet the DB2 database has one buffer pool, IBMDEFAULTBP , which is only 16MB in size!If this is the case at your site, create a buffer pool for the SYSCATSPACE catalog tablespace, one for the TEMPSPACE tablespace, and at least two more buffer pools: BP_RAND and BP_SEQ . Tablespaces that are accessed randomly should be assigned to a buffer pool with random objectives, BP_RAND. Tablespaces that are accessed sequentially (with asynchronous prefetch I/O) should be assigned to a buffer pool with sequential objectives, BP_SEQ . You can create additional buffer pools depending on performance objectives for certain transactions; for example, you could make a buffer pool large enough to store an entire "hot," or very frequently accessed, table. When large tables are involved, some DB2 users have great success placing the indexes for important tables into an index, BP_IX , buffer pool.
Buffer pools that are too small result in excessive, unnecessary, physical I/O. Buffer pools that are too large put a system at risk for operating system paging and consume unnecessary CPU cycles managing the overallocated memory. Somewhere between "too small" and "too large" lies the size that is just right. The right size exists where the point of diminishing returns is reached. If you're not using a tool to automate the diminishing returns analysis, you should scientifically test buffer pool performance (hit ratios, I/O times, physical I/O read rates) at incremental sizes until an optimum size is reached. Because businesses constantly change and grow, the "optimum size" decision should be reevaluated periodically.
1. SQL COST ANALYSIS
One bad SQL statement can ruin your whole day. Time and time again I've seen a single, relatively simple SQL statement bring a finely tuned database and machine to its knees. For many of these statements, there isn't a DB2 UDB configuration parameter under the sun (or in the doc) that can make right the high cost of an errant SQL statement.Making matters worse, the DBA's hands are frequently tied: You can't change the SQL can because it's provided by an application vendor (such as SAP , PeopleSoft , or Siebel ). This leaves the DBA three courses of action:
1. Change or add indexes
2. Change clustering
3. Change catalog statistics.
What's more, today's robust applications are made up of hundreds or thousands of different SQL statements. These statements are executed at varying rates of frequency depending on application functionality and the business needs du jour. A SQL statement's true cost is the resource cost to execute it once multiplied by the number of times it is executed.
The monumental task that confronts each DBA is the challenge of identifying the SQL statements with the highest "true cost," and working to reduce the costs of these statements.
You can find out the resource cost to execute a SQL statement once from native DB2 Explain utilities, a number of tools from third-party vendors, or the DB2 UDB SQL Event Monitor data. But the frequency of statement execution can only be learned through careful and time-consuming analysis of DB2 UDB SQL Event Monitor data.
In researching problem SQL statements, the standard procedure used by DBAs is:
1. Create an SQL Event Monitor, write to file:
$> db2 "create event monitor SQLCOST for statements write to ..."
2. Activate the event monitor (be sure ample free disk space is available):$> db2 "set event monitor SQLCOST state = 1"
3. Let the application run.4. Deactivate the event monitor:
$> db2 "set event monitor SQLCOST state = 0"
5. Use the DB2-supplied db2evmon tool to format the raw SQL Event Monitor data (hundreds of megabytes of free disk space may be required depending on SQL throughput rates):$> db2evmon -db DBNAME -evm SQLCOST
> sqltrace.txt
6. Browse through the formatted file scanning for unusually large cost numbers, a time-consuming process:$> more sqltrace.txt
7. Undertake a more complete analysis of the formatted file that attempts to identify unique statements (independent of literal values), each unique statement's frequency (how many times it occurred), and the aggregate of its total CPU, sort, and other resource costs. Such a thorough analysis could take a week or more on just a 30-minute sample of application SQL activity.To reduce the time it takes to identify SQL statements with high costs, you can consider many sources of available information:
From Tip 4, be sure to compute the number of rows read from each table per transaction. If the resulting number seems high, the DBA may be able to identify problem statements by searching the SQL Event Monitor formatted output for the table name in question (this will narrow the search, and possibly save some time).
From Tip 3, be sure to compute the asynchronous read percentage and physical I/O read rates for each tablespace. If a tablespace has a very high asynchronous read percentage and way above average physical I/O read rates, one or more of the tables in the tablespace is probably being scanned. Query the catalog and find out which tables are assigned to the suspect tablespaces (one table per tablespace provides the best performance instrumentation), then search the SQL Event Monitor formatted output for the tables. This, too, may help narrow the search for costly SQL statements.
Try to look at DB2 Explain information for each of the SQL statements being executed by the application. However, I've found that high frequency, lower-cost statements often rob a machine of its capacity and ability to provide desired performance.
If analysis time is short and maximum performance is critical, consider vendor tools that can quickly automate the process of identifying resource intensive SQL statements.Staying in Tune
Optimum performance requires not only eliminating high cost SQL statements, but also making sure that appropriate physical infrastructures are in place. Peak performance results when all the tuning knobs are set just right, memory is allocated to pools and heaps effectively, and I/O is evenly balanced across disks. Although it takes time to measure and make adjustments, the DBA who performs these 10 suggestions will be very successful at satisfying internal and external DB2 customers. As e-businesses change and grow, even the best-administered database will need regular fine-tuning. The DBA's job is never done!
我的栏目
标题搜索
我的存档
数据统计
- 访问量: 334132
- 日志数: 230
- 建立时间: 2007-11-19
- 更新时间: 2024-04-03
