NODES = dict(
# 0 1 2 3 4 5
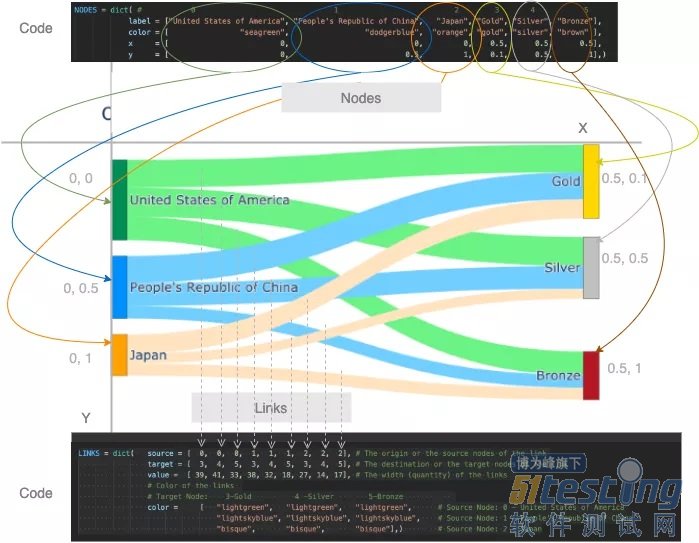
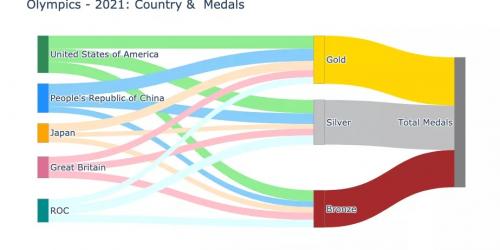
label = ["United States of America", "People's Republic of China", "Japan", "Gold", "Silver", "Bronze"],
color = [ "seagreen", "dodgerblue", "orange", "gold", "silver", "brown" ],
x = [ 0, 0, 0, 0.5, 0.5, 0.5],
y = [ 0, 0.5, 1, 0.1, 0.5, 1],
hovertemplate=" ",)
LINK_LABELS = []
for country in ["USA","China","Japan"]:
for medal in ["Gold","Silver","Bronze"]:
LINK_LABELS.append(f"{country}-{medal}")
LINKS = dict(source = [ 0, 0, 0, 1, 1, 1, 2, 2, 2],
# 链接的起点或源节点
target = [ 3, 4, 5, 3, 4, 5, 3, 4, 5],
# 链接的目的地或目标节点
value = [ 39, 41, 33, 38, 32, 18, 27, 14, 17],
# 链接的宽度(数量)
# 链接的颜色
# 目标节点:3-Gold 4 -Silver 5-Bronze
color = ["lightgreen", "lightgreen", "lightgreen", # 源节点:0 - 美国
"lightskyblue", "lightskyblue", "lightskyblue", # 源节点:1 - 中国
"bisque", "bisque", "bisque"], # 源节点:2 - 日本
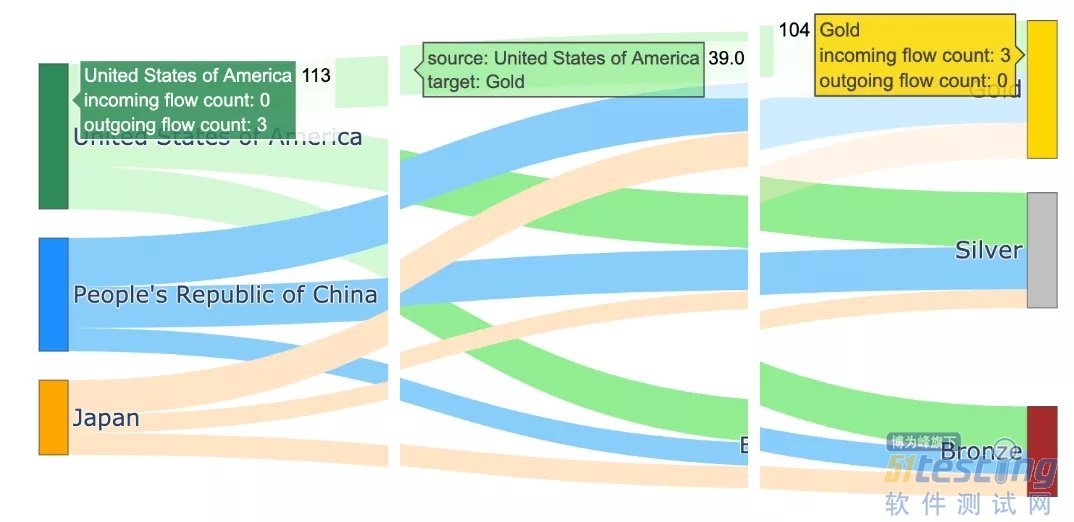
label = LINK_LABELS,
hovertemplate="%{label}",)
data = go.Sankey(node = NODES, link = LINKS)
fig = go.Figure(data)
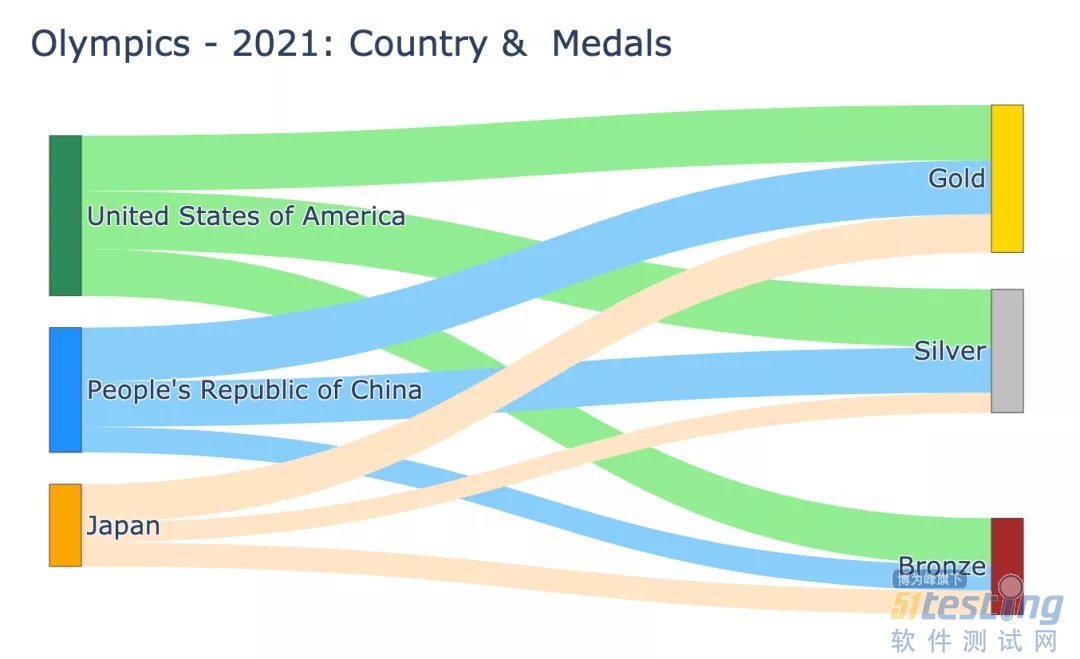
fig.update_layout(title="Olympics - 2021: Country & Medals",
font_size=16, width=1200, height=500,)
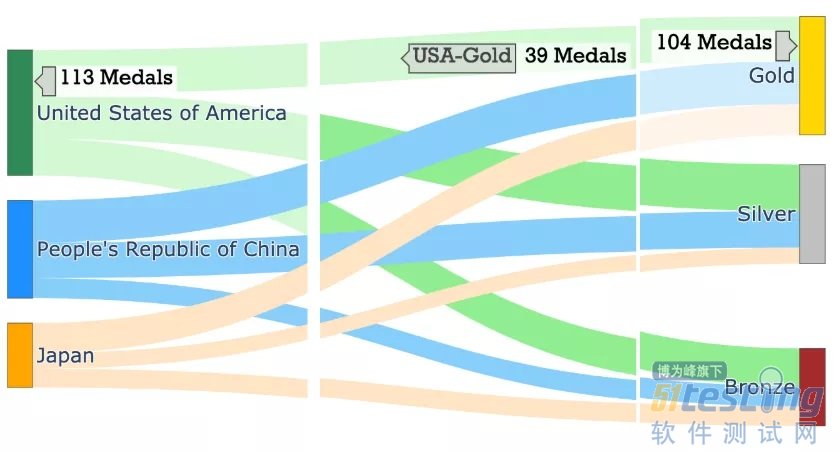
fig.update_traces(valueformat='3d',
valuesuffix='Medals',
selector=dict(type='sankey'))
fig.update_layout(hoverlabel=dict(bgcolor="lightgray",
font_size=16,
font_family="Rockwell"))
fig.show("png") #fig.show()