�g�{�R�A�I�q.o0跟踪被测应用程序的事件和异常
�u�B�~�B�v�Y7g-c051Testing软件测试网�w�j#[&h"b ~陈能技51Testing软件测试网5[,n�b�z�n�\2@9Z
2007-9-24
�l�},k _�A�l�R2b�[0 J�R"w�}�D%^6}!}(X�X�x0在使用TestComplete测试一个应用程序的时候,你可以跟踪程序产生的各种事件并把它们记录到test log中。
7o8q4|3k(e�k�j�l�Q;q051Testing软件测试网�o6|�J0{�x�^"H总览
${$J�x+R�I�x*D0TC能把debug信息,异常信息,模块加载和卸载,线程创建等事件跟踪记录下来。见下表:
.\�q7{ `�?0h�C ]0�k8?�d%])}8v�Z0
| Event | Type | Descrīption |
| Create process | Message | The application under test created a new process. |
| Create thread | Message | The application started a new thread. |
| Exception | Error | An exception occurred in the application under test. If the application was compiled with debug information, the Remarks pane of the Test Log panel will display a call stack for the exception. The DbgServices plug-in includes several options that have effect when exception tracing (see below). |
| Exit process | Message | The process ended. |
| Exit thread | Message | The application finished a thread. |
| Load DLL | Message | The application loaded a dynamic link library. |
| Unload DLL | Message | The application unloaded a dll. |
| Output debug string | Message | The application sent this string to the DbgServices object by calling the OutputDebugString function (Win32 API). |
�I�H&`�k0m�b051Testing软件测试网�t8Z�t5r
R�V:h�A-U r!l Y)v�\�n�m0事件被作为信息输出到log,如下图:
)],O�V�h9E9S�d0:V�G�V�Y�D.G-|1l)p0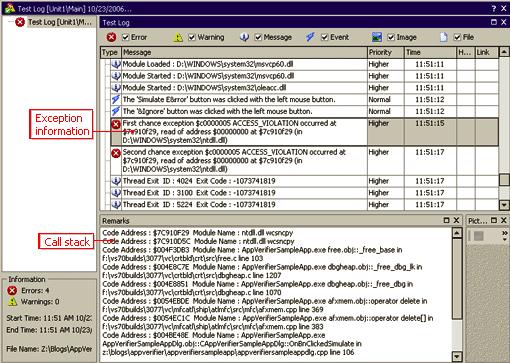
�x*[�a
Y�N�P�C0u051Testing软件测试网6U/G�@+c�G4{�r%K#|�a51Testing软件测试网 k#A�e'H�C�l�M
使用Debug运行模式
%~�{�}9g�v�j2J�H0可以用两种方法设置Debug运行模式,一种是在TestdApps编辑窗口,设置Run Mode为Debug,Parameters输入命令行参数和工作目录。51Testing软件测试网6]/^8E�_#u8}:p�x1|
51Testing软件测试网(P#T�\�Q�Z.z1C;q"c另外一种方式是在脚本中设置,例如下面的脚本
5w'_8A�I.s"`3F�Q�e�W0var
�q%n'H8`5B+K0 MyApp : OleVariant;
.w9d+Q2Z0A�p*q0begin51Testing软件测试网�r�j8y�?&M
// Obtains the tested application
�a N�W�L�h�n�[�q�\&U:z0 MyApp := TestedApps.MyTestedApp;51Testing软件测试网�s+z�o�a�H D
51Testing软件测试网:m5m�F�j t�W�S"L$z%U
// Specifies the run mode parameters
$h"g�~"I4h�I�k X0 MyApp.Params.DebugParams.CommandLineParameters := '-t -e';
(b�z#h%s3[0 MyApp.Params.DebugParams.WorkFolder := 'C:\MyFolder';51Testing软件测试网�u
F%O6_�w�_�T
�D'A�_!g�I�p�T-D�\,?�F0 51Testing软件测试网�W%J&[�V�H @)`
// Activates the Debug run mode51Testing软件测试网/p�@�R�N�F�X�x
MyApp.Params.DebugParams.Activate;51Testing软件测试网/n�Z�n�N�o4b�a
...
�o:^�~7d�`�}:b)z�}�Y0end;51Testing软件测试网 g;G�_�A
F�k�[ D!I�h
51Testing软件测试网�n&z�?�S-}"b使用DbgServices对象
9c
g#I%q�k�g*y0使用DbgServices对象的各种方法,例如LaunchTestedApplication、LaunchAllTestedApplications、LaunchApplication、AttachToProcess,可以让TC附加到被测应用程序的运行进程并把debug进程权限赋给TC,从而使你可以跟踪应用程序的事件和异常信息。51Testing软件测试网-m�J�Q�`%R�O"?�s"Q�E
51Testing软件测试网6Y
?$a�v
h�B
X�y使用这种方式与使用Debug运行模式是类似的效果,但是提供了以下便利:
7[�M�C;F�h�L0支持任何运行模式的应用程序,而不仅仅是包括在项目的TestedApp里的应用程序。51Testing软件测试网�U�X*v�~0v1m
M
它让你可以附加到一个运行在操作系统的进程并监视它所发生的事件。51Testing软件测试网*^)K�x�f�]�Y�u"C+s
如果你使用RunAs运行模式,然后使用LaunchTestedApplication或LaunchAllTestedApplications方法来运行程序,TC会用Debug模式在指定的用户账号下运行被测程序。(也就是说你可以在另外一个用户账号下debug程序)。
�h Z�d#{�W�~"H051Testing软件测试网&m9~!n'~(d�D�i*V�D下面是个关于使用DbgServices的例子:51Testing软件测试网3G/t�W)q�z2d�O+o�y
p := DbgServices.LaunchTestedApplication[0];
�E6`'B�|-J�M�{�s0l0 w := p.WaitWindow('TfrmDebugServices', 'Debug Services', 1, 10000);
�J�b;|�i�H$d�E0
�f�w�M"z�N�y:o9p0 DbgServices.Options.EnableEvents := True;
(B;l.C�q�a.\�D0�^-V�@-P.P�~3V0 DbgServices.Options.ActiveExceptions := True;
;K�v�^�^�O�Z3S�s%x0 Log.Message('Exceptions are being traced.');
�a6z*U�e4c�@1w0 w.Window('TButton', 'Test All').ClickButton;51Testing软件测试网2L V�W�W(h�V
Delay(2000);
�k;H�r�B�d�B9x*G
V X�] R0
�~6P)d#b�@8Q0 DbgServices.Options.ActiveExceptions := False;
)v�s s�r�v
U.c9l�X0 Log.Message('Exceptions are not traced.');51Testing软件测试网�c4f-V�Y�H
w.Window('TButton', 'Exception').Click;
3T�Y�n#m�g�r0s
b�F�Z�R0 w.Close;
�c�z�f�c.W�G0.k)P�G
p�E3\6^�^'c�F%@:~.i0 repeat
�S�O:m0b2`3`0 Delay(500);51Testing软件测试网�m"P�J�v�|�o�U&v+l
until not p.Exists;51Testing软件测试网0G!e�|�p"C�O$m�c%p�L(B
51Testing软件测试网�X�\�D
O�`�Y

