ЎЎЎЎ5ЎўҪб№ыЙъіЙІҝ·ЦЈә
ЎЎЎЎҙъАнЦР»сИЎөДКэҫЭЧоЦХРҙөҪТ»ёцcsvОДјюЦРЈ¬ФЪҙъАнІҝ·ЦөДЦҙРРәҜКэНкіЙә󣬶БИЎХвёцОДјюөДДЪИЭЈ¬ЙъіЙПа№ШөДҪб№ыКэҫЭәННјЖ¬ЈЁНјЖ¬ФЪpythonЦРЗгПтУЪК№УГmatlibplot°ьЈ©ЎЈЧоЦХҪ«ЖдРҙіЙhtmlөДҪб№ыұЁёжРОКҪЈә
ЎЎЎЎЦШТӘҙъВлЈә
| def generate_results(dir, test_name): print '\nGenerating Results...' try: merged_log = open(dir + '/agent_stats.csv', 'rb').readlines() # this log contains commingled results from all agents except IOError: sys.stderr.write('ERROR: Can not find your results log file\n') merged_error_log = merge_error_files(dir) if len(merged_log) == 0: fh = open(dir + '/results.html', 'w') fh.write(r'<html><body><p>None of the agents finished successfully. There is no data to report.</p></body></html>\n') fh.close() sys.stdout.write('ERROR: None of the agents finished successfully. There is no data to report.\n') return timings = list_timings(merged_log) best_times, worst_times = best_and_worst_requests(merged_log) timer_group_stats = get_timer_groups(merged_log) timing_secs = [int(x[0]) for x in timings] # grab just the secs (rounded-down) throughputs = calc_throughputs(timing_secs) # dict of secs and throughputs throughput_stats = corestats.Stats(throughputs.values()) resp_data_set = [x[1] for x in timings] # grab just the timings response_stats = corestats.Stats(resp_data_set) # calc the stats and load up a dictionary with the results stats_dict = get_stats(response_stats, throughput_stats) # get the pickled stats dictionaries we saved runtime_stats_dict, workload_dict = load_dat_detail(dir) # get the summary stats and load up a dictionary with the results summary_dict = {} summary_dict['cur_time'] = time.strftime('%m/%d/%Y %H:%M:%S', time.localtime()) summary_dict['duration'] = int(timings[-1][0] - timings[0][0]) + 1 # add 1 to round up summary_dict['num_agents'] = workload_dict['num_agents'] summary_dict['req_count'] = len(timing_secs) summary_dict['err_count'] = len(merged_error_log) summary_dict['bytes_received'] = calc_bytes(merged_log) # write html report fh = open(dir + '/results.html', 'w') reportwriter.write_head_html(fh) reportwriter.write_starting_content(fh, test_name) reportwriter.write_summary_results(fh, summary_dict, workload_dict) reportwriter.write_stats_tables(fh, stats_dict) reportwriter.write_images(fh) reportwriter.write_timer_group_stats(fh, timer_group_stats) reportwriter.write_agent_detail_table(fh, runtime_stats_dict) reportwriter.write_best_worst_requests(fh, best_times, worst_times) reportwriter.write_closing_html(fh) fh.close() # response time graph def resp_graph(nested_resp_list, dir='./'): fig = figure(figsize=(8, 3)) # image dimensions ax = fig.add_subplot(111) ax.set_xlabel('Elapsed Time In Test (secs)', size='x-small') ax.set_ylabel('Response Time (secs)' , size='x-small') ax.grid(True, color='#666666') xticks(size='x-small') yticks(size='x-small') axis(xmin=0) x_seq = [item[0] for item in nested_resp_list] y_seq = [item[1] for item in nested_resp_list] ax.plot(x_seq, y_seq, color='blue', linestyle='-', linewidth=1.0, marker='o', markeredgecolor='blue', markerfacecolor='yellow', markersize=2.0) savefig(dir + 'response_time_graph.png') # throughput graph def tp_graph(throughputs_dict, dir='./'): fig = figure(figsize=(8, 3)) # image dimensions ax = fig.add_subplot(111) ax.set_xlabel('Elapsed Time In Test (secs)', size='x-small') ax.set_ylabel('Requests Per Second (count)' , size='x-small') ax.grid(True, color='#666666') xticks(size='x-small') yticks(size='x-small') axis(xmin=0) keys = throughputs_dict.keys() keys.sort() values = [] for key in keys: values.append(throughputs_dict[key]) x_seq = keys y_seq = values ax.plot(x_seq, y_seq, color='red', linestyle='-', linewidth=1.0, marker='o', markeredgecolor='red', markerfacecolor='yellow', markersize=2.0) savefig(dir + 'throughput_graph.png') try: # graphing only works on systems with Matplotlib installed print 'Generating Graphs...' import graph graph.resp_graph(timings, dir=dir+'/') graph.tp_graph(throughputs, dir=dir+'/') except: sys.stderr.write('ERROR: Unable to generate graphs with Matplotlib\n') print '\nDone generating results. You can view your test at:' print '%s/results.html\n' % dir |
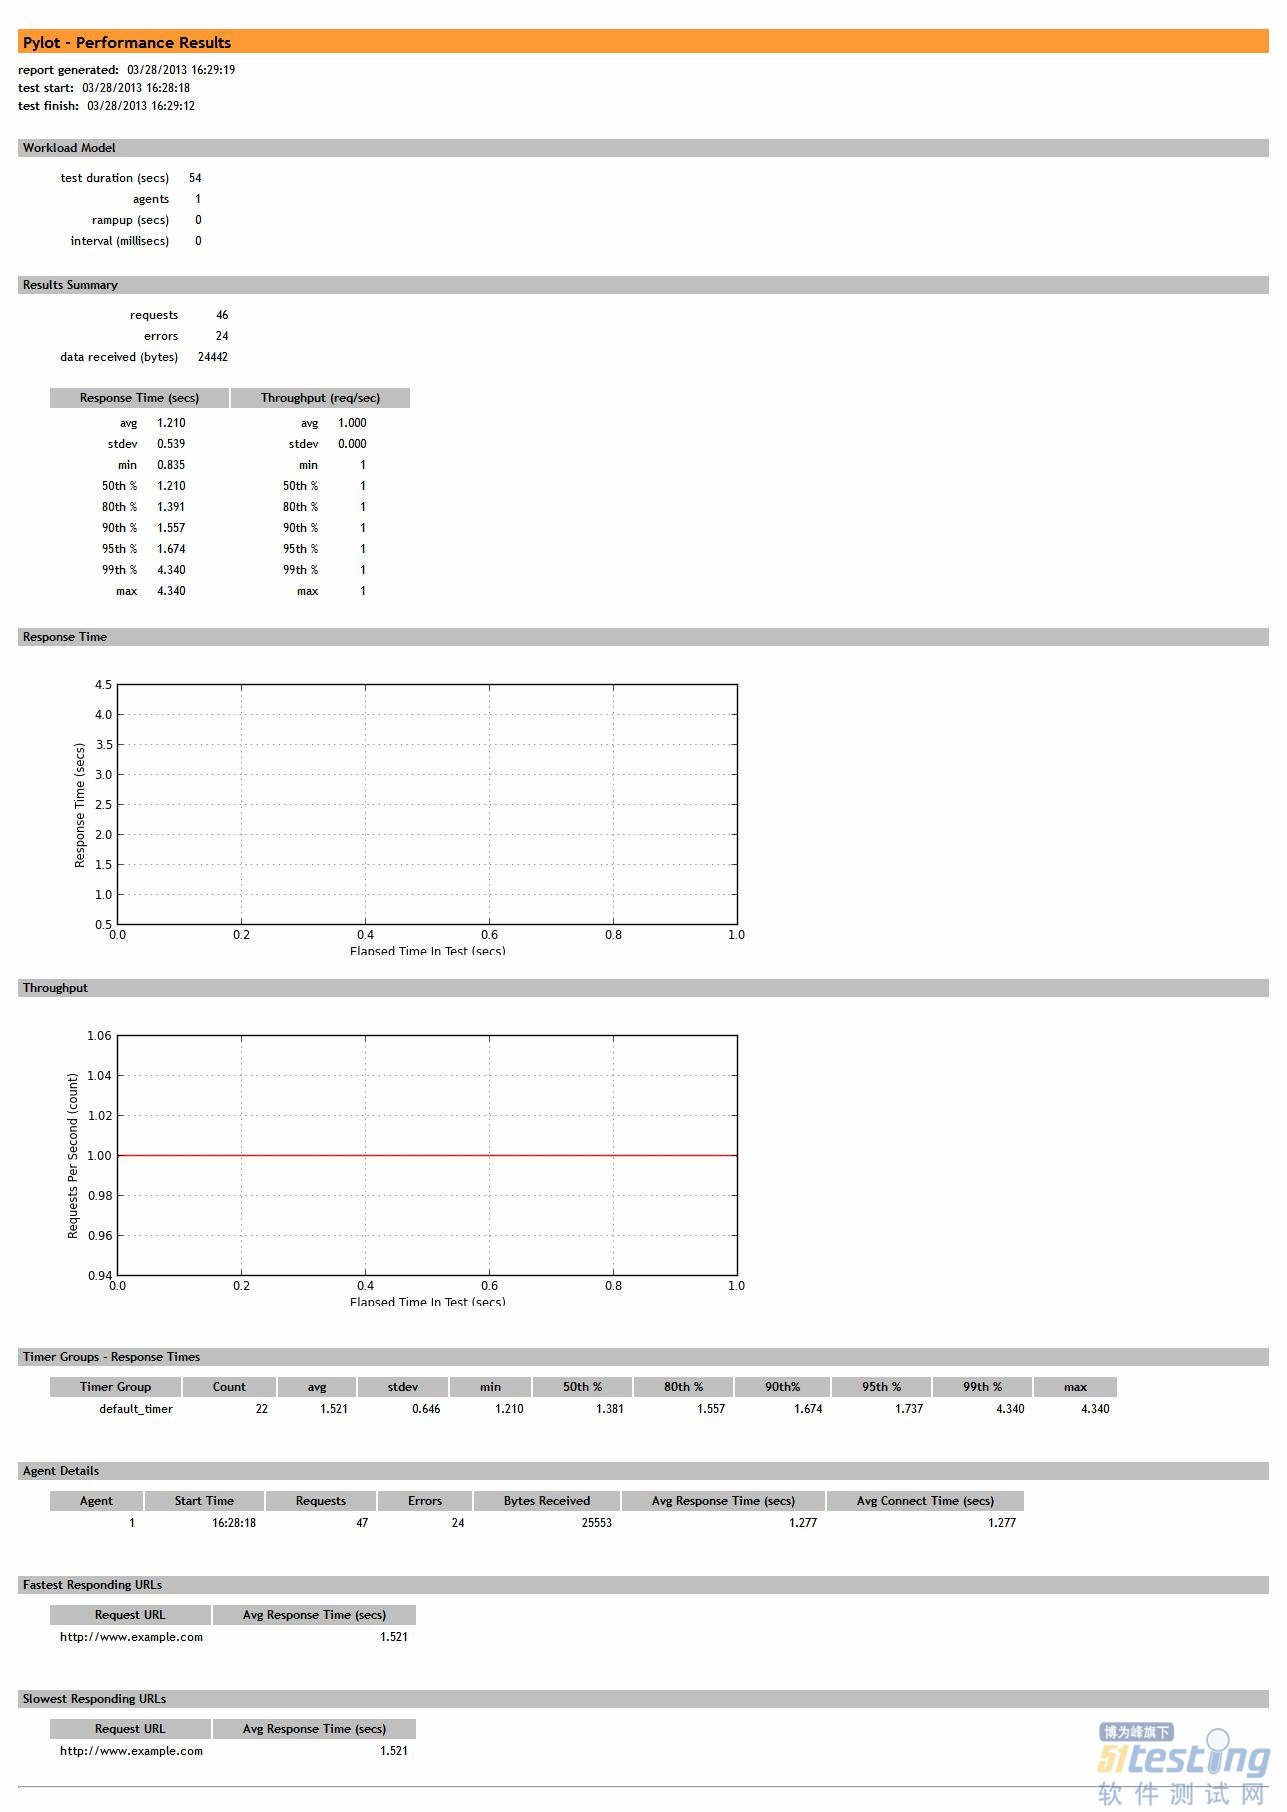
ЎЎЎЎ¶ФУЪПоДҝөДФЛРРЈ¬јИҝЙТФІЙИЎҝШЦЖМЁ·ҪКҪЈ¬ТІҝЙТФМṩёшQAИЛФұGUIөД·ҪКҪЎЈPylotЦРМṩБЛәЬәГөДGUIЦ§іЦЈ¬ҝЙТФЧчОӘКҫАэК№УГЎЈКөјКЙПІ»ҪЁТйК№УГGUIөД·ҪКҪЈ¬БнНвpylotЦРГ»УРУГ»§Цё¶ЁІЯВФөДЦ§іЦЈ¬ХвёцРиТӘЧФјәЧЁГЕҪшРРҝӘ·ўЈ»БнНвҫНКЗpylotЦРөДАа·вЧ°Ҫб№№»№І»КЗәЬәГЈ¬¶ФТФәуөДА©Х№АҙЛө»№РиТӘТ»¶ЁөДёьёДЎЈө«КЗЧчОӘТ»°гК№УГТСҫӯЧг№»БЛЈ¬ПВГжКЗpylotөДЧоЦХұЁёжҪб№ыЈЁЦ»ЧцКөАэК№УГЈ©ЎЈ