

6.4 持续性观测
在稳定性测试中除了需要关注服务和节点的瞬时异常并对其加以分析,还需要检测在长期的测试中各个服务是否会出现泄漏类的缺陷,例如十分常见的内存泄漏和文件描述符泄漏。这些缺陷只有随着系统长时间运行,问题一点点地放大才能被测试人员关注到。因为不论是内存还是句柄,短时间内的微小波动都不足以证明存在问题,所以检测这类问题一般都需要把测试时间拉长并持续观测相关资源的变化。当然,测试人员不仅需要关注内存泄漏和文件描述符泄漏,还需要观测系统数据的增长变化来判断是否有异常的数据增长,或者本应该清理的数据没有被清理。这些问题的出现同样会为系统的稳定性埋下深深的隐患。例如,在一个大数据产品中会频繁运行很多I/O密集型的任务,这些任务通常会通过Job对象执行。虽然任务结束后K8s有相关的策略来回收Pod,但Job对象本身依然保存在集群中,如果不加以清理,那么随着数据日益增多势必会影响K8s集群的性能和稳定性,甚至最终引起集群的崩溃。所以,测试人员需要通过较长时间的稳定性测试来发现这些问题,也需要验证系统回收资源的速度能否超过系统占用资源的速度。
综上所述,我们的监控组件中除了需要有本章已经介绍过的异常事件监控的能力,还需要有可以持续观测系统资源变化的能力。在第5章介绍的Prometheus可以很好地满足这个需求,只不过目前Prometheus开源出的Exporter监控的范围并没有那么广泛,测试人员势必需要根据自己项目的特点来进行定制与开发。本节将介绍如何在Prometheus中开发Exporter的内容。
6.4.1 自定义Exporter
开发Exporter其实并不困难,Prometheus提供了主流语言的客户端帮助用户简化开发过程。例如,在Python的客户端中定义一个Counter类型的指标,如代码清单6-15所示。
代码清单6-15 在Python的客户端中定义一个Counter类型的指标 :
from prometheus_client import Counter, start_http_server,Gauge
import time
if __name__ == '__main__':
g = Gauge('my_inprogress_requests', 'Description of gauge')
g.set(4.2)
c = Counter('my_failures', 'Description of counter')
start_http_server(8000)
// 通过for循环模拟周期性(每5秒)收集系统数据并调用Counter的inc方法来设置监控数值
while True:
time.sleep(5)
c.inc(1.6)
运行代码清单6-15所示的代码后就可以通过8000端口访问Exporter了。这里需要注意的是,Prometheus提供的客户端只能用来帮助用户较为方便地定义各项监控指标,具体的监控逻辑还是需要用户自己来完成的,包括将当前的数据进行持久化(否则Exporter重启后监控数据会被重置)。接下来就通过开发一个可以监控每个容器的套接字和僵尸进程的Exporter展示Go的客户端的使用,以及一个完整的Exporter所具备的能力。
之所以不在节点维度监控套接字和僵尸进程,是因为这里只是通过这样一个场景来展示Exporter的开发流程和其与容器交互的方法,并不表示这是监控套接字和僵尸进程的最好方式。在动手开发之前,需要先了解如何获取容器中的套接字和僵尸进程信息。这里选择向容器发送一段shell命令的方式来查询容器当前的信息,这个方法的效果与用户在命令行中使用kubectl exec命令的效果是一样的,如代码清单6-16所示。
代码清单6-16 向容器发送一段shell命令 :
func Exec(clientset *kubernetes.Clientset, config *restclient.Config, commands []
string, namespace, podName, container string) (string, error) {
logger := log.WithFields(log.Fields{
"namespace": namespace,
"pod": podName,
})
req := clientset.CoreV1().RESTClient().Post().Resource("pods").Name(podName)
.Namespace(namespace).SubResource("exec")
scheme := runtime.NewScheme()
if err := corev1.AddToScheme(scheme); err != nil {
return "", errors.Wrapf(err, "error to NewScheme, namespace = %s podName =
%s", namespace, podName)
}
parameterCodec := runtime.NewParameterCodec(scheme)
req.VersionedParams(&corev1.PodExecOptions{
Command: commands,
Container: container,
Stdin: false,
Stdout: true,
Stderr: true,
TTY: false,
}, parameterCodec)
exec, err := remotecommand.NewSPDYExecutor(config, "POST", req.URL())
if err != nil {
logger.Errorf("error to NewSPDYExecutor in container")
return "", errors.Wrapf(err, "error to NewSPDYExecutor in container, namespace
= %s podName = %s", namespace, podName)
}
var stdout, stderr bytes.Buffer
err = exec.Stream(remotecommand.StreamOptions{
Stdin: nil,
Stdout: &stdout,
Stderr: &stderr,
Tty: false,
})
if err != nil {
return "", errors.Wrapf(err, "error to exec command in container, namespace =
%s podName = %s command = %s output = %s stderr = %s",
namespace, podName, strings.Join(commands, ","),
stdout.String(), stderr.String())
}
if stderr.String() != "" {
return "", errors.Errorf("perform command %s failed, err is:%s", fmt.
Sprintf(strings.Join(commands, ",")), stderr.String())
}
return stdout.String(), nil
}
代码清单6-16实现了一个向容器发送shell命令的函数,它比较适合执行一些简单的命令。但是,如果用户需要执行的shell命令过于复杂,并需要保存到一个脚本中,就需要使用把脚本复制到容器中的功能,该功能的实现如代码清单6-17所示。
代码清单6-17 复制一个文件到容器中:
func UploadFileToK8s(clientset *kubernetes.Clientset, config *rest.Config, path
string, byteArray []byte, podName, containerName, namespace
string) error {
stdin := bytes.NewReader(byteArray)
req := clientset.CoreV1().RESTClient().Post().
Resource("pods").
Name(podName).
Namespace(namespace).
SubResource("exec")
scheme := runtime.NewScheme()
if err := corev1.AddToScheme(scheme); err != nil {
return errors.Wrap(err, "error to NewScheme")
}
commands := []string{"cp", "/dev/stdin", path}
parameterCodec := runtime.NewParameterCodec(scheme)
req.VersionedParams(&corev1.PodExecOptions{
Command: commands,
Container: containerName,
Stdin: true,
Stdout: true,
Stderr: true,
TTY: false,
}, parameterCodec)
exec, err := remotecommand.NewSPDYExecutor(config, "POST", req.URL())
if err != nil {
return errors.Wrap(err, "error to NewSPDYExecutor in container")
}
var stdout, stderr bytes.Buffer
err = exec.Stream(remotecommand.StreamOptions{
Stdin: stdin,
Stdout: &stdout,
Stderr: &stderr,
Tty: false,
})
fmt.Println(stdout.String())
if err != nil {
return errors.Wrapf(err, "failed copy file to container, output = %s stderr =
%s filePath = %s", stdout.String(), stderr.String(), path)
}
return nil
}
工具函数准备好后,可以开始考虑执行什么命令来获取套接字和僵尸进程的信息了,很多人第一时间想到的是通过ss和ps命令来进行查询,但是有一个问题,并不是所有容器都安装了这两个命令的,我们是否可以通过依赖更少的方式进行获取呢?答案是肯定的。在Linux中/proc目录是一个非常特殊的存在,它被很多人称为伪文件系统。实际上,/proc目录下保存的是当前内核运行状态的一系列特殊文件,用户可以通过这些文件查看有关系统硬件和当前正在运行的进程的信息。所以,这里只需要通过查询/proc目录下对应的文件就可以获取套接字和僵尸进程的信息了。
/proc/net/tcp文件中提供了TCP(transmission control protocol,传输控制协议)的连接信息,如果只需要获取TCP连接信息,就可以通过head命令进行查询,查询结果如图6-3所示。
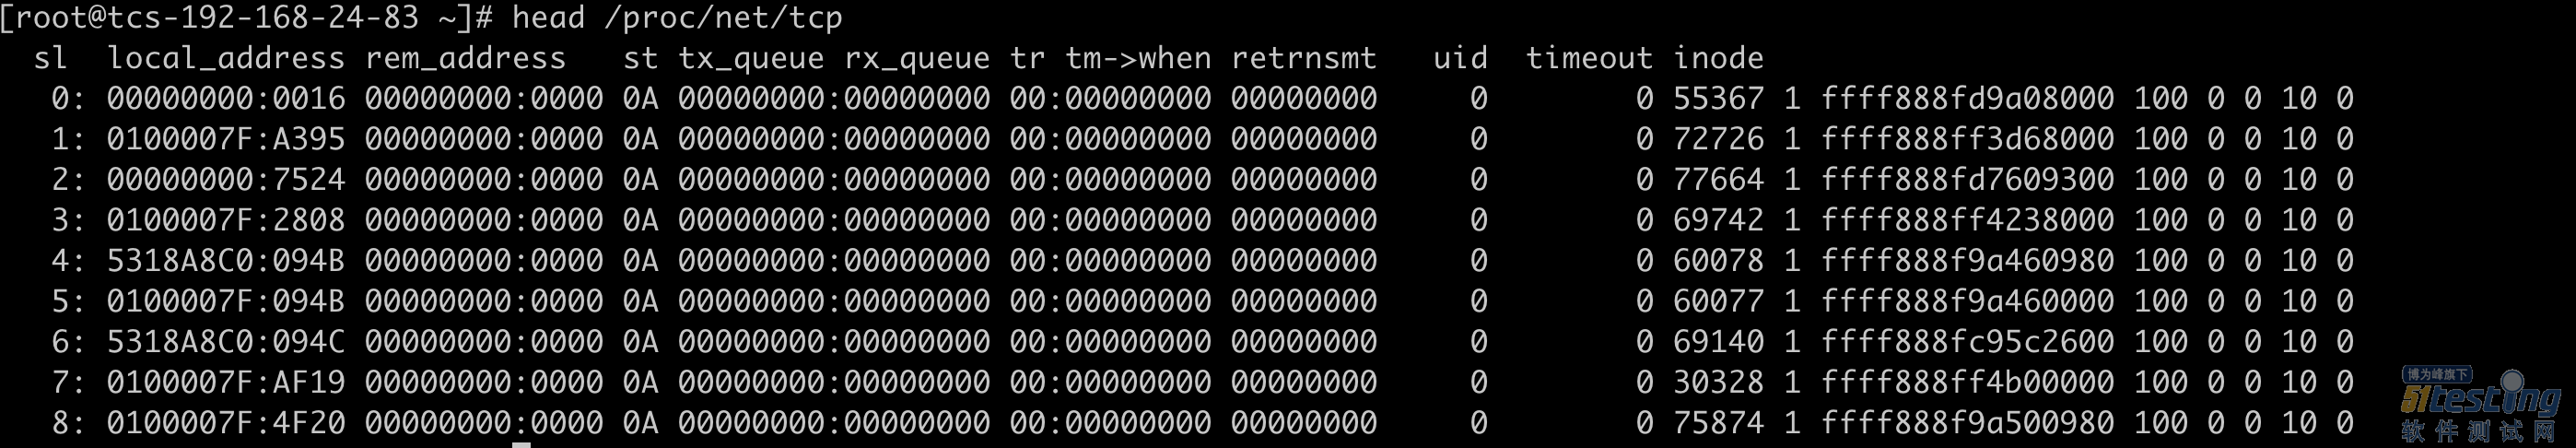
图6-3 查询TCP连接信息
对于图6-3中的查询结果,我们主要关注第四列,它表示当前套接字的状态。图6-4列出了套接字状态码的映射关系。

图6-4 套接字状态码的映射关系
一般出现套接字泄漏的原因大多数是套接字被打开后没有关闭,这时大量的套接字会处于CLOSE_WAIT状态,所以这里需要监控的目标就是计算当前容器中有多少套接字处于该状态。对应的shell命令为cat /proc/net/tcp | awk '{print $4}' | grep 08 | wc -l。
查看是否存在僵尸进程的方法也是类似的,用户可以通过/proc/pid/stat查看每个进程当前的状态,如果当前进程是僵尸进程,则在文件中用Z来对其进行标识,所以这里的思路就是遍历/proc下每个进程的stat文件,并统计处于Z状态的进程数量,对应的shell命令为find /proc -maxdepth 2 -name stat | xargs cat 2>/dev/null | grep Z | wc -l。
了解以上内容后就可以实现监控容器套接字和僵尸进程的功能了。关于初始化K8s客户端的操作就不再详细说明,读者可以翻看第3章相关内容。本案例中通过定义两个Gauge类型的指标来进行监控,并且程序需要遍历当前集群所有Pod中的容器并将其注册到Prometheus中。需要注意的是,由于集群是动态变化的,随时都会有新的Pod被创建和销毁,因此在程序中需要开启一个独立的协程来对监控指标进行周期性的更新,如代码清单6-18所示。
代码清单6-18 周期性更新监控指标:
var (
sdMetrics = make(map[string]prometheus.Gauge)
zProcessMetrics = make(map[string]prometheus.Gauge)
kubeConfig *rest.Config
k8s *kubernetes.Clientset
)
func init() {
log.SetOutput(os.Stdout)
log.Info("init the kubeconfig")
if isExist, err := PathExists("kubeconfig_ziyuan"); err != nil {
panic(err)
} else {
if isExist {
log.Info("now out of K8s cluster")
kubeConfig, err = clientcmd.BuildConfigFromFlags("", "kubeconfig_ziyuan")
} else {
log.Info("now In k8s cluster")
kubeConfig, err = rest.InClusterConfig()
}
if err != nil {
log.Error("cannot init the kubeconfig")
panic(err.Error())
}
}
var err error
k8s, err = kubernetes.NewForConfig(kubeConfig)
if err != nil {
log.Error("cannot init the K8s client")
panic(err.Error())
}
log.Info("init the K8s client done, now begin to monitor the K8s")
register := func() {
namespaceList, err := k8s.CoreV1().Namespaces().List(context.Background(),
metav1.ListOptions{})
if err != nil {
log.Error(err)
os.Exit(1)
}
for _, n := range namespaceList.Items {
namespace := n.Name
podList, err := k8s.CoreV1().Pods(namespace).List(context.Background(),
metav1.ListOptions{})
if err != nil {
panic(errors.Wrapf(err, "cannot list K8s with namespace %s", namespace))
}
// 遍历所有Pod
for _, pod := range podList.Items {
if pod.Status.Phase != "Running" {
continue
}
// 遍历Pod下的容器
for _, container := range pod.Status.ContainerStatuses {
sdGauge := prometheus.NewGauge(prometheus.GaugeOpts{
Name: "namespace_container_Socket_Close_Wait",
Help: "num of socket with CLOSE-WAIT status in container",
ConstLabels: map[string]string{
"namespace": namespace,
"pod": pod.Name,
"container": container.Name,
},
})
if _, ok := sdMetrics[pod.Name + "," + namespace]; !ok {
prometheus.MustRegister(sdGauge)
sdMetrics[pod.Name + "," + namespace] = sdGauge
}
zProcessGauge := prometheus.NewGauge(prometheus.GaugeOpts{
Name: "namespace_container_zombie_Process_Num",
Help: "num of zombie process num in container",
ConstLabels: map[string]string{
"namespace": namespace,
"pod": pod.Name,
"container": container.Name,
},
})
if _, ok := zProcessMetrics[pod.Name]; !ok {
prometheus.MustRegister(zProcessGauge)
zProcessMetrics[pod.Name] = zProcessGauge
}
}
}
}
}
// 先注册一次
register()
// 周期性注册名字空间下所有Pod中容器的指标
go func() {
for {
time.Sleep(time.Minute * 10)
register()
}
}()
}
实现周期性更新监控指标的功能后,就可以编写代码来实现与容器的交互并获取相关的监控数据了。需要注意的是,这部分代码仍然需要周期性执行,并且每次执行都要从内存中获取最新的监控指标,具体实现如代码清单6-19所示。
代码清单6-19 周期性获取监控数据:
func main() {
// 周期性获取最新的监控指标
go func() {
for {
for podInfo, guage := range sdMetrics {
tmp := strings.Split(podInfo, ",")
podName := tmp[0]
namespace := tmp[1]
log.WithFields(log.Fields{
"namespace": namespace,
"pod": podName,
})
pod, _ := k8s.CoreV1().Pods(namespace).Get(context.Background(),
podName, metav1.GetOptions{})
for _, container := range pod.Status.ContainerStatuses {
commands := []string{"sh", "-c", "cat /proc/net/tcp
| awk '{print $4}' |grep 08|wc -l"}
output, err := prometheus.Exec(k8s, kubeConfig, commands,namespace,
podName, container.Name)
if err != nil {
log.Error(err.Error())
continue
}
closeWait, err := strconv.ParseFloat(strings.Replace(output,
"\n","", -1), 32)
if err != nil {
fmt.Fprintf(os.Stdout, "err %s\n", errors.Wrap(err, "cannot trans
string to float"))
continue
}
guage.Set(closeWait)
log.Infof("successfully collect %s's socket status", podName)
}
}
for podInfo, guage := range sdMetrics {
tmp := strings.Split(podInfo, ",")
podName := tmp[0]
namespace := tmp[1]
log.WithFields(log.Fields{
"namespace": namespace,
"pod": podName,
})
pod, _ := k8s.CoreV1().Pods(namespace).Get(context.Background(), podName,
metav1.GetOptions{})
for _, container := range pod.Status.ContainerStatuses {
// 僵尸进程
commands := []string{"sh", "-c", "find /proc -maxdepth 2 -name stat|xargs
cat 2>/dev/null|grep Z|wc -l"}
output, err := prometheus.Exec(k8s, kubeConfig, commands, namespace,
podName, container.Name)
if err != nil {
fmt.Fprintf(os.Stdout, "err %s\n", errors.Wrapf(err, "cannot get exec
the command %s", commands))
continue
}
zProcess, err := strconv.ParseFloat(strings.Replace(output, "\n", "",
-1), 32)
if err != nil {
fmt.Fprintf(os.Stdout, "err %s\n", errors.Wrap(err, "cannot trans
string to float"))
continue
}
guage.Set(zProcess)
log.Info("successfully collect %s's zombie process status", podName)
}
}
time.Sleep(time.Minute * 10)
}
}()
http.Handle("/metrics", promhttp.Handler())
log.Fatal(http.ListenAndServe("0.0.0.0:80", nil))
}
至此,我们便完成了Exporter的开发工作,接下来需要将程序制作成镜像,部署到K8s集群中,并注册到Prometheus中。这里选择监控套接字和僵尸进程的方式,主要是为了演示使用K8s客户端与容器进行命令交互。实际上,大家也可以使用其他更优雅的方式达到该目的。例如,以DaemonSet形式在每个节点启动一个Pod,并切换名字空间获取每个容器的进程与套接字信息,这也是一种常用的方式。大家可以思考一下如何实现这种方式。


