

一:背景
1. 讲故事
上个月我写过一篇 如何洞察 C# 程序的 GDI 句柄泄露 文章,当时用的是 GDIView + WinDbg 把问题搞定,前者用来定位泄露资源,后者用来定位泄露代码,后面有朋友反馈两个问题:
·GDIView 统计不准怎么办?
· 我只有 Dump 可以统计吗?
其实那篇文章也聊过,在 x64 或者 wow64 的程序里,在用户态内存段中有一个 GDI Shared Handle Table 句柄表,这个表中就统计了各自句柄类型的数量,如果能统计出来也就回答了上面的问题,对吧。
32bit 程序的 GDI Shared Handle Table 段是没有的,即 _PEB.GdiSharedHandleTable = NULL。
0:002> dt ntdll!_PEB GdiSharedHandleTable 01051000 +0x0f8 GdiSharedHandleTable : (null)
有了这些前置基础,接下来就可以开挖了。
二:挖 GdiSharedHandleTable
1. 测试代码
为了方便测试,我来造一个 DC句柄 的泄露。
internal class Program
{
[DllImport("Example_20_1_5", CallingConvention = CallingConvention.Cdecl)]
extern static void GDILeak();
static void Main(string[] args)
{
try
{
GDILeak();
}
catch (Exception ex)
{
Console.WriteLine(ex.Message);
}
Console.ReadLine();
}
}
然后就是 GDILeak 的 C++ 实现代码。
extern "C"
{
_declspec(dllexport) void GDILeak();
}
void GDILeak()
{
while (true)
{
CreateDCW(L"DISPLAY", nullptr, nullptr, nullptr);
auto const gdiObjectsCount = GetGuiResources(GetCurrentProcess(), GR_GDIOBJECTS);
std::cout << "GDI objects: " << gdiObjectsCount << std::endl;
Sleep(10);
}
}
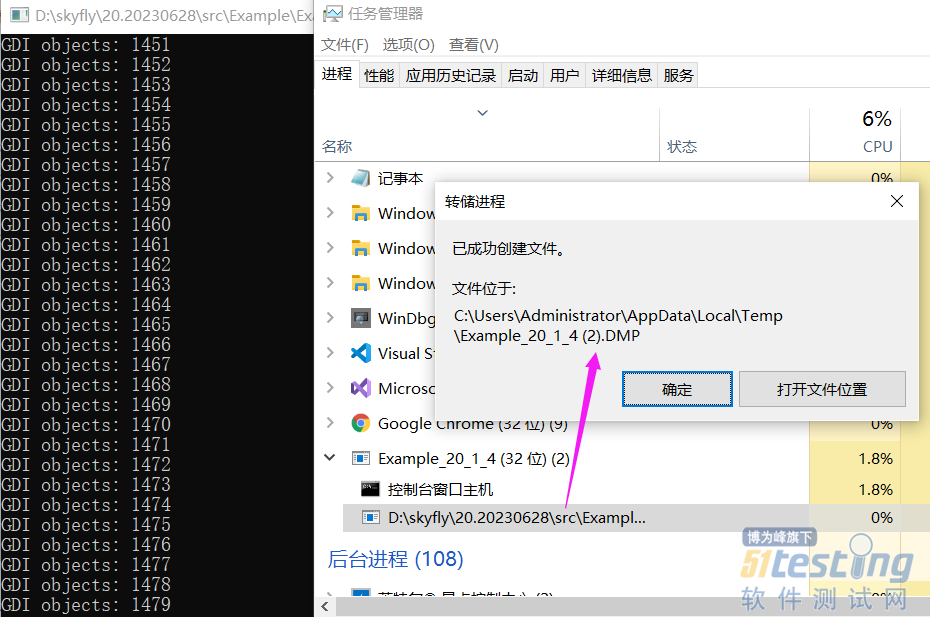
程序跑起来后,如果你是x64的程序那没有关系,但如果你是 32bit 的程序一定要生成一个 Wow64 格式的 Dump,千万不要抓它的 32bit dump,否则拿不到 GdiSharedHandleTable 字段也就无法后续分析了,那如何生成 Wow64 格式的呢?我推荐两种方式。
·使用64bit任务管理器(系统默认)生成
· 使用 procdump -64 -ma QQ.exe 中的 -64 参数
这里我们采用第一种方式,截图如下:
2. 分析 GdiSharedHandleTable
使用伪寄存器变量提取出 GdiSharedHandleTable 字段,输出如下:
0:000> dt ntdll!_PEB GdiSharedHandleTable @$peb
+0x0f8 GdiSharedHandleTable : 0x00000000`03560000 Void
接下来使用 !address 找到这个 GdiSharedHandleTable 的首末地址。
0:000> !address 0x00000000`03560000
Usage: Other
Base Address: 00000000`03560000
End Address: 00000000`036e1000
Region Size: 00000000`00181000 ( 1.504 MB)
State: 00001000 MEM_COMMIT
Protect: 00000002 PAGE_READONLY
Type: 00040000 MEM_MAPPED
Allocation Base: 00000000`03560000
Allocation Protect: 00000002 PAGE_READONLY
Additional info: GDI Shared Handle Table
Content source: 1 (target), length: 181000
上一篇我们聊过每新增一个GDI句柄都会在这个表中增加一条 GDICell,输出如下:
typedef struct {
PVOID64 pKernelAddress;
USHORT wProcessId;
USHORT wCount;
USHORT wUpper;
USHORT wType;
PVOID64 pUserAddress;
} GDICell;
这个 GDICell 有两个信息比较重要。
·wProcessId 表示进程 ID
· wType 表示句柄类型。
理想情况下是对 句柄类型 进行分组统计就能知道是哪里的泄露,接下来的问题是如何找呢?可以仔细观察结构体, wProcessId 和 wType 的偏移是 3USHORT=6byte,我们在内存中找相对偏移不就可以了吗?接下来在内存中搜索这块
0:000> ~.
. 0 Id: 101c.4310 Suspend: 0 Teb: 00000000`009bf000 Unfrozen
Start: Example_20_1_4_exe!wmainCRTStartup (00000000`00d4ffe0)
Priority: 0 Priority class: 32 Affinity: fff
0:000> s-w 03560000 036e1000 101c
00000000`03562060 101c 0000 af01 0401 0b00 0830 0000 0000 ..........0.....
00000000`035782a0 101c ff1d ffff ffff 0000 0000 1d0f 010f ................
00000000`0357c688 101c 0000 3401 0401 0160 0847 0000 0000 .....4..`.G.....
...
00000000`035a5f98 101c 0000 0801 0401 0dc0 08a1 0000 0000 ................
00000000`035a5fb0 101c 0000 0801 0401 0c60 08a1 0000 0000 ........`.......
00000000`035a5fc8 101c 0000 0801 0401 0840 08a1 0000 0000 ........@.......
00000000`035a5fe0 101c 0000 0801 0401 0b00 08a1 0000 0000 ................
1.

从卦中可以看到,当前有1029个 GDICell 结构体,接下来怎么鉴别每一条记录上都是什么类型呢?其实这里是有枚举的。
DC = 0x01
Region = 0x04
Bitmap = 0x05
Palette =0x08
Font =0x0a
Brush = 0x10
Pen = 0x30
即 GDIView 中的 红色一列 。
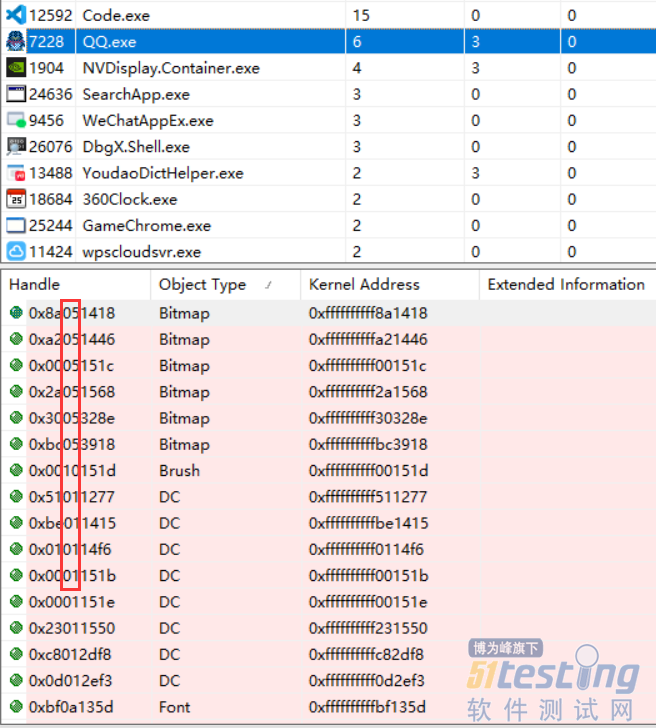
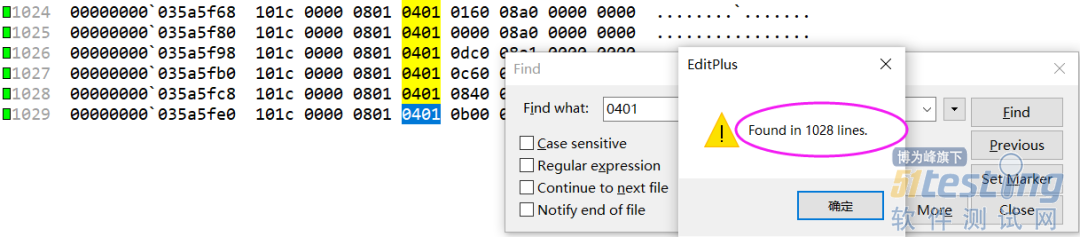
到这里我们可以通过肉眼观察 + F5 检索,可以清晰的看到1029 个句柄对象,其中 1028 个是 DC 对象,其实这就是我们泄露的,截图如下:
3. 脚本处理
如果大家通读会发现这些都是固定步骤,完全可以写成比如 C++ 和 Javascript 的格式脚本,在 StackOverflow 上还真有这样的脚本。
$$ Run as: $$>a<DumpGdi.txt
$$ Written by Alois Kraus 2016
$$ uses pseudo registers r0-5 and r8-r14
r @$t1=0
r @$t8=0
r @$t9=0
r @$t10=0
r @$t11=0
r @$t12=0
r @$t13=0
r @$t14=0
$$ Increment count is 1 byte until we find a matching field with the current pid
r @$t4=1
r @$t0=$peb
$$ Get address of GDI handle table into t5
.foreach /pS 3 /ps 1 ( @$GdiSharedHandleTable { dt ntdll!_PEB GdiSharedHandleTable @$t0 } ) { r @$t5 = @$GdiSharedHandleTable }
$$ On first call !address produces more output. Do a warmup
.foreach /pS 50 ( @$myStartAddress {!address @$t5} ) { }
$$ Get start address of file mapping into t2
.foreach /pS 4 /ps 40 ( @$myStartAddress {!address @$t5} ) { r @$t2 = @$myStartAddress }
$$ Get end address of file mapping into t3
.foreach /pS 7 /ps 40 ( @$myEndAddress {!address @$t5} ) { r @$t3 = @$myEndAddress }
.printf "GDI Handle Table %p %p", @$t2, @$t3
.for(; @$t2 < @$t3; r @$t2 = @$t2 + @$t4)
{
$$ since we walk bytewise through potentially invalid memory we need first to check if it points to valid memory
.if($vvalid(@$t2,4) == 1 )
{
$$ Check if pid matches
.if (wo(@$t2) == @$tpid )
{
$$ increase handle count stored in $t1 and increase step size by 0x18 because we know the cell structure GDICell has a size of 0x18 bytes.
r @$t1 = @$t1+1
r @$t4 = 0x18
$$ Access wType of GDICELL and increment per GDI handle type
.if (by(@$t2+6) == 0x1 ) { r @$t8 = @$t8+1 }
.if (by(@$t2+6) == 0x4 ) { r @$t9 = @$t9+1 }
.if (by(@$t2+6) == 0x5 ) { r @$t10 = @$t10+1 }
.if (by(@$t2+6) == 0x8 ) { r @$t11 = @$t11+1 }
.if (by(@$t2+6) == 0xa ) { r @$t12 = @$t12+1 }
.if (by(@$t2+6) == 0x10 ) { r @$t13 = @$t13+1 }
.if (by(@$t2+6) == 0x30 ) { r @$t14 = @$t14+1 }
}
}
}
.printf "\nGDI Handle Count %d", @$t1
.printf "\n\tDeviceContexts: %d", @$t8
.printf "\n\tRegions: %d", @$t9
.printf "\n\tBitmaps: %d", @$t10
.printf "\n\tPalettes: %d", @$t11
.printf "\n\tFonts: %d", @$t12
.printf "\n\tBrushes: %d", @$t13
.printf "\n\tPens: %d", @$t14
.printf "\n\tUncategorized: %d\n", @$t1-(@$t14+@$t13+@$t12+@$t11+@$t10+@$t9+@$t8)
最后我们用脚本跑一下,哈哈,是不是非常清楚。
0:000> $$>a< "D:\testdump\DumpGdi.txt"
GDI Handle Table 0000000003560000 00000000036e1000
GDI Handle Count 1028
DeviceContexts: 1028
Regions: 0
Bitmaps: 0
Palettes: 0
Fonts: 0
Brushes: 0
Pens: 0
Uncategorized: 0
三:总结
如果大家想从 DUMP 文件中提取 GDI 句柄泄露类型,这是一篇很好的参考资料,相信能从另一个角度给你提供一些灵感。
本文内容不用于商业目的,如涉及知识产权问题,请权利人联系51Testing小编(021-64471599-8017),我们将立即处理


