

memory_profiler
pip install memory_profiler#Load its magic function
%load_ext memory_profiler
from memory_profiler import profile
memory_profiler可以完成以下的工作:
1、查找一行的内存消耗
我们只需要在代码的前面加上魔法函数 %memit
%memit x = 10+5
#Output
peak memory: 54.01 MiB, increment: 0.27 MiB
这里,峰值内存(peak memory)是运行此代码的进程消耗的内存。增量只是由于添加这行代码而需要/消耗的内存。同样的逻辑也适用于以下其他的显示。
2、查找函数的内存消耗
在调用函数的行的开头添加魔法函数。
def addition():
a = [1] * (10 ** 1)
b = [2] * (3 * 10 ** 2)
sum = a+b
return sum
%memit addition()
#Output
peak memory: 36.36 MiB, increment: 0.01 MiB
3、逐行查找函数的内存消耗
如果需要记录函数中每一行的内存使用,我们可以使用@profile 装饰器。 但是@profile 仅适用于在单独模块中定义的函数,因此我们将首先使用 %%file 创建一个名为 demo.py 的简单模块,其中包含我们的函数。
%%file demo.py
from memory_profiler import profile
@profile
def addition():
a = [1] * (10 ** 1)
b = [2] * (3 * 10 ** 2)
sum = a+b
return sum
现在,我们可以调用该函数
from demo import addition
%memit addition()
#Output
Line # Mem usage Increment Line Contents
================================================
2 36.4 MiB 36.4 MiB @profile
3 def addition():
4 36.4 MiB 0.0 MiB a = [1] * (10 ** 1)
5 3851.1 MiB 3814.7 MiB b = [2] * (3 * 10 ** 2)
6 7665.9 MiB 3814.8 MiB sum = a+b
7 7665.9 MiB 0.0 MiB return sum
peak memory: 7665.88 MiB, increment: 7629.52 MiB
4、完整python脚本的内存消耗
这个这个方法不能再 notebook 中使用。我们必须创建 python 脚本并通过命令行运行它。
#create script.py
import time
@profile
def function1():
n = 100000
a = [1] * n
time.sleep(1)
return a
@profile
def function2():
n = 200000
b = [1] * n
time.sleep(1)
return b
if __name__ == "__main__":
function1()
function2()
之后运行脚本并查看:
#On command line
mprof run script.py
#To generate plot
mprof plot
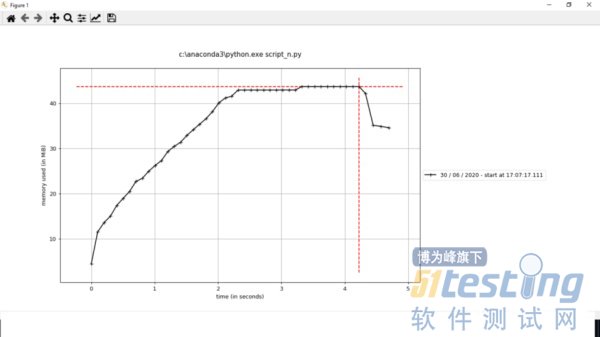
我们可以看到内存消耗与时间的关系图:
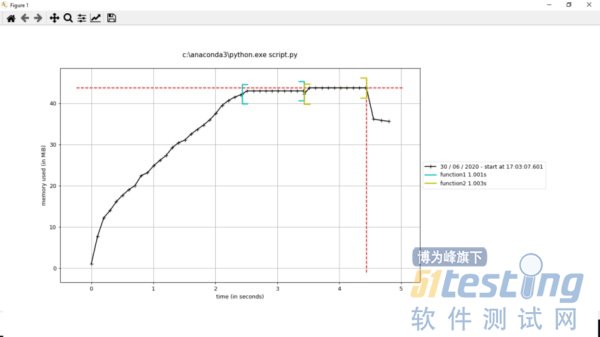
@profile装饰器没有必要放在函数前面,如果我们不保留它,我们不会看到函数级内存消耗,但我们会看到整个脚本的内存消耗。
Pytorch-Memory-Utils
通过Pytorch-Memory-Utils工具,我们在使用显存的代码中间插入检测函数,这样就可以输出在当前行代码时所占用的显存。这个对于我们计算模型的GPU显存占用是非常方便的,通过计算显存占用,我们才能够最大化训练的batch size,保证训练的最优速度。
import torch
import inspect
from torchvision import models
from gpu_mem_track import MemTracker # 引用显存跟踪代码
device = torch.device('cuda:0')
frame = inspect.currentframe()
gpu_tracker = MemTracker(frame) # 创建显存检测对象
gpu_tracker.track() # 开始检测
cnn = models.vgg19(pretrained=True).to(device) # 导入VGG19模型并且将数据转到显存中
gpu_tracker.track()
然后可以发现程序运行过程中的显存变化(第一行是载入前的显存,最后一行是载入后的显存):
At __main__ <module>: line 13 Total Used Memory:472.2 Mb
+ | 1 * Size:(128, 64, 3, 3) | Memory: 0.2949 M | <class 'torch.nn.parameter.Parameter'>
+ | 1 * Size:(256, 128, 3, 3) | Memory: 1.1796 M | <class 'torch.nn.parameter.Parameter'>
+ | 1 * Size:(64, 64, 3, 3) | Memory: 0.1474 M | <class 'torch.nn.parameter.Parameter'>
+ | 2 * Size:(4096,) | Memory: 0.0327 M | <class 'torch.nn.parameter.Parameter'>
+ | 1 * Size:(512, 256, 3, 3) | Memory: 4.7185 M | <class 'torch.nn.parameter.Parameter'>
+ | 2 * Size:(128,) | Memory: 0.0010 M | <class 'torch.nn.parameter.Parameter'>
+ | 1 * Size:(1000, 4096) | Memory: 16.384 M | <class 'torch.nn.parameter.Parameter'>
+ | 6 * Size:(512,) | Memory: 0.0122 M | <class 'torch.nn.parameter.Parameter'>
+ | 1 * Size:(64, 3, 3, 3) | Memory: 0.0069 M | <class 'torch.nn.parameter.Parameter'>
+ | 1 * Size:(4096, 25088) | Memory: 411.04 M | <class 'torch.nn.parameter.Parameter'>
+ | 1 * Size:(4096, 4096) | Memory: 67.108 M | <class 'torch.nn.parameter.Parameter'>
+ | 5 * Size:(512, 512, 3, 3) | Memory: 47.185 M | <class 'torch.nn.parameter.Parameter'>
+ | 2 * Size:(64,) | Memory: 0.0005 M | <class 'torch.nn.parameter.Parameter'>
+ | 3 * Size:(256,) | Memory: 0.0030 M | <class 'torch.nn.parameter.Parameter'>
+ | 1 * Size:(128, 128, 3, 3) | Memory: 0.5898 M | <class 'torch.nn.parameter.Parameter'>
+ | 2 * Size:(256, 256, 3, 3) | Memory: 4.7185 M | <class 'torch.nn.parameter.Parameter'>
+ | 1 * Size:(1000,) | Memory: 0.004 M | <class 'torch.nn.parameter.Parameter'>
At __main__ <module>: line 15 Total Used Memory:1387.5 Mb
通过上面的报告,很容易发现一个问题。
首先我们知道VGG19所有层的权重大小加起来大约是548M(这个数值来源于Pytorch官方提供的VGG19权重文件大小),我们将上面报告打印的Tensor-Memory也都加起来算下来也差不多551.8Mb。但是,我们算了两次打印的显存实际占用中:1387.5 – 472.2 = 915.3 MB。
Pytorch在开始运行程序时需要额外的显存开销,这种额外的显存开销与我们实际使用的模型权重显存大小无关。 这个额外的显存Pytorch的开发者也对此进行说明了,这部分释放后的显存可以用,只不过不在Nvidia-smi中显示罢了,所以我们无需关注。
本文内容不用于商业目的,如涉及知识产权问题,请权利人联系51Testing小编(021-64471599-8017),我们将立即处理


