在用Vue做服务端渲染时,大家对Vue服务端渲染的性能持怀疑态度,业界也有一些尝试,不过完整的产品项目和数据分析比较少。结合线上和本地压测,我们对 Vue 和 Nunjucks 针对模板渲染Render时间,CPU占用,内存占用进行全面的对比测试。
渲染性能对比
通过实现相同的模板功能,分别针对无缓存和有缓存进行了对比测试. 测试方法,通过ab压测工具对页面进行测试,Node层收集页面render渲染时间, 然后进行汇总统计分析。
Nunjucks 测试模板
<div> <div> <h2>h5GameList</h2> <ul> {% for item in h5GameList.data.list %} <li><a href="{{item.downloadUrl}}">{{item.name}}-{{item.resume}}</a></li> {% endfor %} </ul> </div> <div> <h2>recommendList</h2> {% for item in recommendList.data %} <div> <a href="{{item.downloadUrl}}">{{item.recommendBriefResume}}</a> <p>{{item.recommendResume}}</p> </div> {% endfor %} </div> <div> <h2>bestList</h2> {% for item in bestList.data.list %} <div> <a href="{{item.downloadUrl}}">{{item.resume}}</a> <p>{{item.packageName}}</p> </div> {% endfor %} </div> <div> <h2>bookingList</h2> {% for item in bookingList.data %} <div> <a href="{{item.logoUrl}}">{{item.name}}-{{item.categoryName}}</a> <p>{{item.resume}}</p> </div> {% endfor %} </div> </div> |
Vue测试模板
<template> <div> <div> <h2>h5GameList</h2> <ul> <li v-for="item in h5GameList.data.list" ><a v-bind:href="item.downloadUrl">{{item.name}}-{{item.resume}}</a></li> </ul> </div> <div> <h2>recommendList</h2> <div v-for="item in recommendList.data" > <a v-bind:href="item.downloadUrl">{{item.recommendBriefResume}}</a> <p>{{item.recommendResume}}</p> </div> </div> <div> <h2>bestList</h2> <div v-for="item in bestList.data.list" > <a v-bind:href="item.downloadUrl">{{item.resume}}</a> <p>{{item.packageName}}</p> </div> </div> <div> <h2>bookingList</h2> <div v-for="item in bookingList.data"> <a v-bind:href="item.logoUrl">{{item.name}}-{{item.categoryName}}</a> <p>{{item.resume}}</p> </div> </div> </div> </template> |
测试脚本一:
ab -c 50 -n 1000 http://ip:port/perf/nunjucks/
ab -c 50 -n 1000 http://ip:port/perf/vue/
其中 -n 表示请求数,-c 表示并发数

测试脚本二:
ab -c 50 -n 5000 http://ip:port/perf/nunjucks/
ab -c 50 -n 5000 http://ip:port/perf/vue/
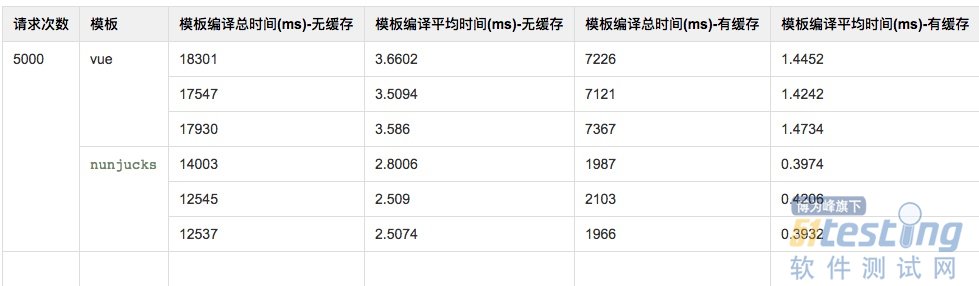
从上面统计来看可以得出如下结论:
●无缓存情况:nunjucks 平均时间比 vue 渲染要快1ms, 差距没想象的大。
●有缓存情况:nunjucks 平均时间是 vue 的3倍左右,但也都是毫秒级别的差异。在整理数据时,nunjucks的render时间都是0-1ms,而vue则要1-3ms。分析一下可知道,nunjucks是基于字符串正则编译的,可以做到预编译缓存,而vue目前的实现方式是通过webpack构建的jsbundle文件(查看构建文件可以看到每个元素和组件都是通过javascript动态创建组合的),然后整个script丢给Node.js 原生vm模块(独立的沙箱运行空间)动态执行script。 目前Vue官方提供了基于Webpack构建Vue字符串的方案,宣传性能会有比较大的提升。这种方案前一段时间做个实践,每一个页面都需要独立构建一个manifest和vue-ssr-server-bundle.json 文件, 比较适合单页面应用,多页面应用构建有冲突,需要自己实现支持,待实践。从线上应用实践来看, render 时间在整个耗时链条里面是非常小的,性能问题大头部分在于网络( DNS,网络连接,网络传输),接口耗时两部分。
●vm对比测试
global.num = 100; const vm = require('vm'); const code = 'var ret = num * num * num;'; const sandbox = { num : 1000}; const benchmark = (msg, fun) => { const start = new Date; for (let i = 0; i < 10000; i++) { fun(); } const end = new Date; console.log(msg + ': ' + (end - start) + 'ms'); }; const ctx = vm.createContext(sandbox); // runInThisContext 用于创建一个独立的沙箱运行空间,code内的代码可以访问外部的global对象,但是不能访问其他变量 benchmark('vm.runInThisContext', () => { vm.runInThisContext(code); }); // runInContext 创建一个独立的沙箱运行空间,sandBox将做为global的变量传入code内,但不存在global变量 benchmark('vm.runInContext', () => { vm.runInContext(code, ctx); }); // 与runInContext 一样, 这里可以直接传sandbox benchmark('vm.runInNewContext', () => { vm.runInNewContext(code, sandbox); }); const script = vm.createScript(code); benchmark('script.runInThisContext', () => { script.runInThisContext(); }); benchmark('script.runInNewContext', () => { script.runInNewContext(sandbox); }); benchmark('script.runInContext', () => { script.runInContext(ctx); }); benchmark('fn', () => { new Function('num', code)(); }); /* vm.runInThisContext: 15ms vm.runInContext: 71ms vm.runInNewContext: 70ms script.runInThisContext: 7ms script.runInNewContext: 59ms script.runInContext: 57ms fn: 9ms script方式都比vm方式快 */ |
线上应用性能数据
首页内容有5-6屏内容,一次性渲染,部分组件动态加载。下图是 Vue 服务端渲染 Render时间:

从首页render-avg的统计来看,== 模板的编译时间非常的短,平均在24ms-27ms之间==,还有优化的空间。
首页访问链路时间

从整个链路时间来看rt(首屏时间) 可以看到, 平均首屏时间小于1s, 而render时间平均在30ms,在整个链路上面,render的时间可以说是可以忽略的,至少从上面图来看,性能问题大头部分在于网络,接口耗时两部分。
CPU和内存占用
前提条件:
●Mac 环境
●Nunjucks 和 Vue 渲染都开启缓存
●Vue 服务端渲染关闭 runInNewContext
●为保证测试的统计准确性,只启动一个工作worker,下面分析只统计 worker进程CPU和内存,排除了 Egg master 和 agent 进程。
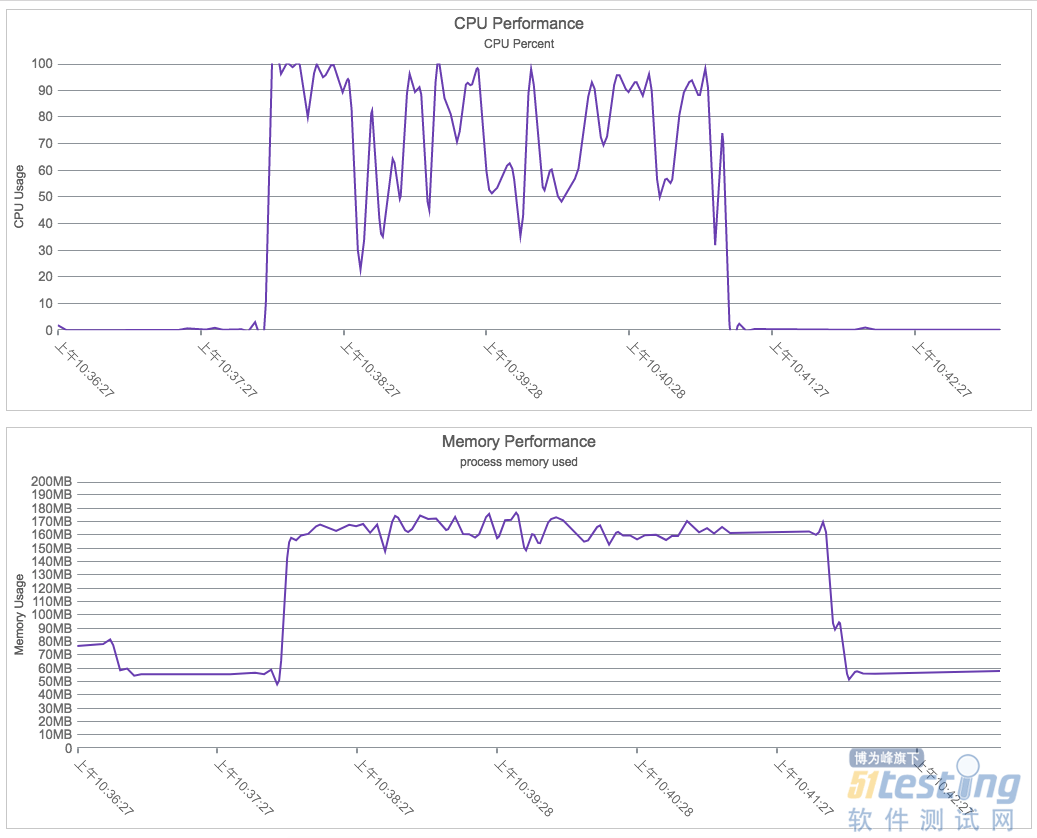
Nunjucks CPU和内存占用
●采集样本:ab -c 100 -n 50000 http://ip:port/perf/nunjucks/
This is ApacheBench, Version 2.3 <$Revision: 1663405 $> Copyright 1996 Adam Twiss, Zeus Technology Ltd, http://www.zeustech.net/ Licensed to The Apache Software Foundation, http://www.apache.org/ Benchmarking 100.84.250.56 (be patient) Completed 5000 requests Completed 10000 requests Completed 15000 requests Completed 20000 requests Completed 25000 requests Completed 30000 requests Completed 35000 requests Completed 40000 requests Completed 45000 requests Completed 50000 requests Finished 50000 requests Server Software: Server Hostname: 100.84.250.56 Server Port: 7001 Document Path: /perf/nunjucks/ Document Length: 13899 bytes Concurrency Level: 100 Time taken for tests: 173.686 seconds Complete requests: 50000 Failed requests: 48138 (Connect: 0, Receive: 0, Length: 48138, Exceptions: 0) Total transferred: 709284995 bytes HTML transferred: 694684887 bytes Requests per second: 287.88 [#/sec] (mean) Time per request: 347.372 [ms] (mean) Time per request: 3.474 [ms] (mean, across all concurrent requests) Transfer rate: 3988.00 [Kbytes/sec] received Connection Times (ms) min mean[+/-sd] median max Connect: 0 10 38.1 2 3410 Processing: 22 336 313.5 241 3416 Waiting: 22 333 302.2 241 3398 Total: 56 347 311.6 247 3432 Percentage of the requests served within a certain time (ms) 50% 247 66% 280 75% 332 80% 367 90% 645 95% 877 98% 1195 99% 1460 100% 3432 (longest request) |
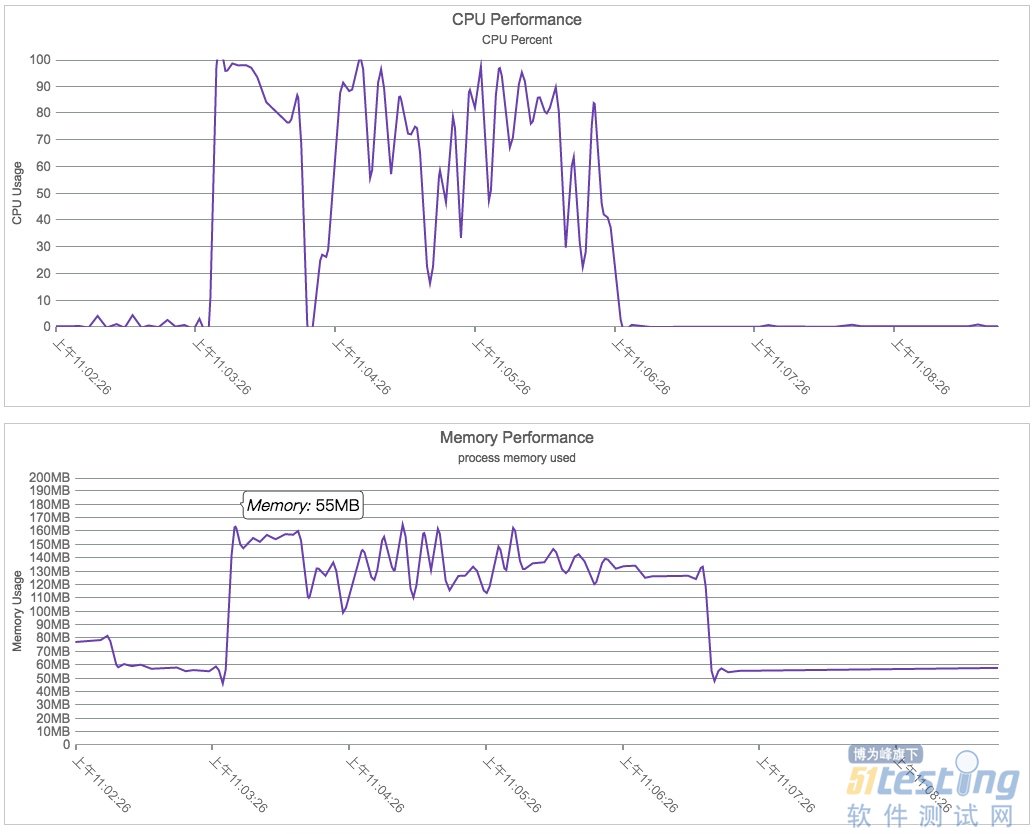
Vue CPU和内存占用
●采集样本:ab -c 100 -n 50000 http://ip:port/perf/vue/
This is ApacheBench, Version 2.3 <$Revision: 1663405 $> Copyright 1996 Adam Twiss, Zeus Technology Ltd, http://www.zeustech.net/ Licensed to The Apache Software Foundation, http://www.apache.org/ Benchmarking 100.84.250.56 (be patient) Completed 5000 requests Completed 10000 requests Completed 15000 requests Completed 20000 requests Completed 25000 requests Completed 30000 requests Completed 35000 requests Completed 40000 requests Completed 45000 requests Completed 50000 requests Finished 50000 requests Server Software: Server Hostname: 100.84.250.56 Server Port: 7001 Document Path: /perf/vue/ Document Length: 13840 bytes Concurrency Level: 100 Time taken for tests: 193.524 seconds Complete requests: 50000 Failed requests: 48989 (Connect: 0, Receive: 0, Length: 48989, Exceptions: 0) Total transferred: 707135621 bytes HTML transferred: 692535158 bytes Requests per second: 258.37 [#/sec] (mean) Time per request: 387.048 [ms] (mean) Time per request: 3.870 [ms] (mean, across all concurrent requests) Transfer rate: 3568.35 [Kbytes/sec] received Connection Times (ms) min mean[+/-sd] median max Connect: 0 10 27.3 2 1384 Processing: 22 377 223.9 285 2236 Waiting: 22 373 217.7 285 2235 Total: 42 386 219.5 290 2239 Percentage of the requests served within a certain time (ms) 50% 290 66% 335 75% 409 80% 481 90% 697 95% 841 98% 1030 99% 1126 100% 2239 (longest request)dou |
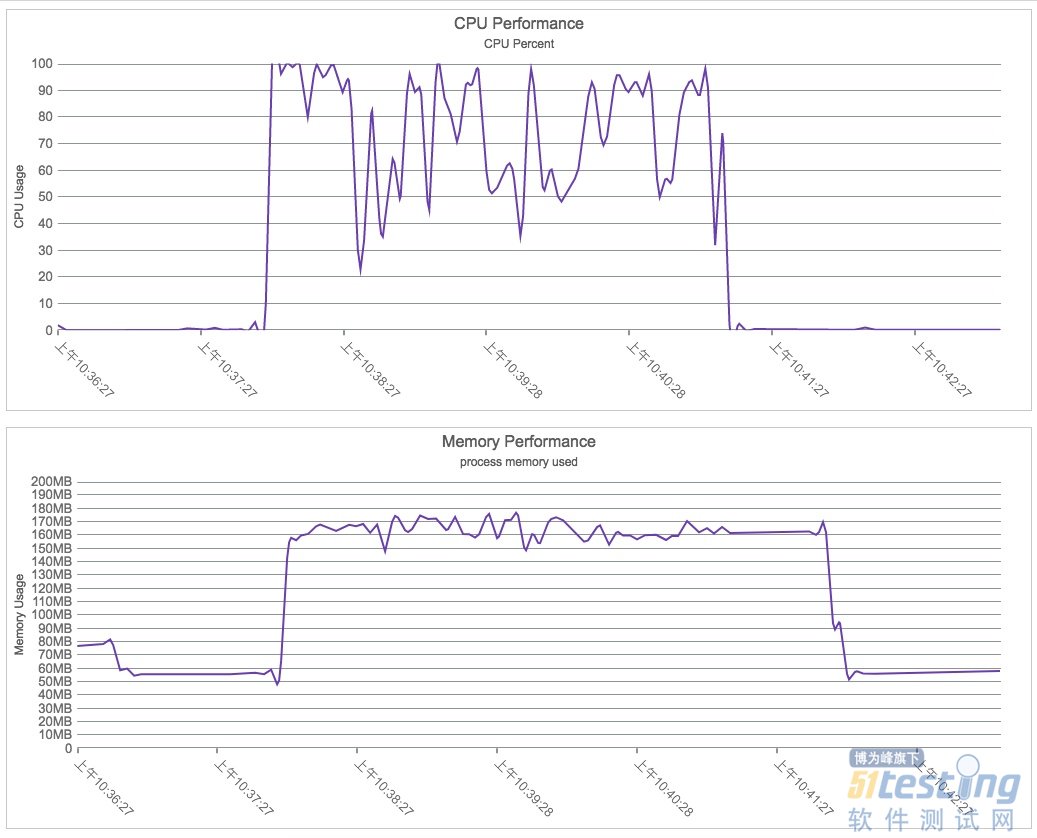
两个图对比发现如下信息:
●压测前 egg 应用启动后,worker 进程内存稳定在 60MB, cpu 使用都小于1%,保证前提条件一致
●压测启动后,nunjucks 和 vue CPU使用迅速飙升到90%,曲线基本保持一样,没有很明显高低之分
●压测启动后,nunjucks 和 vue 内存也是迅速上升,整个压测期间,nunjucks 平均内存使用为 150 MB左右,vue 平均内存使用为 160 MB, vue 内存占用比较稳定。从这个数据可以看出, Vue 服务端渲染 内存占用略微比 nunjucks 高一些。
●压测结束好后,nunjucks 和 vue 的 CPU 使用 迅速降为小于 1%, 内存使用迅速降为 60 MB, 都恢复为压测前的状态,这也表面 nunjucks 和 vue 压测期间没有出现内存泄漏的情况。
Nunjucks与Vue对比分析
首先我们来看看 ab 执行结果的几个关键参数含义:
●Concurrency Level 并发请求数
●Time taken for tests 整个测试持续的时间
●Complete requests 完成的请求数
●Failed requests 失败的请求数(指内容大小不一样,其实是成功的)
●HTML transferred HTML内容传输量
●Requests per second 每秒处理的请求数,mean表示平均值
●Time per request 用户平均请求等待时间
●Time per request(mean, across all concurrent requests) 服务器平均请求处理时间
●Percentage Time 处理时间区间分布,我们关注80%-90%的区间。
下面是 ab -c 100 -n 50000 针对 nunjucks 和 vue 数据对比:
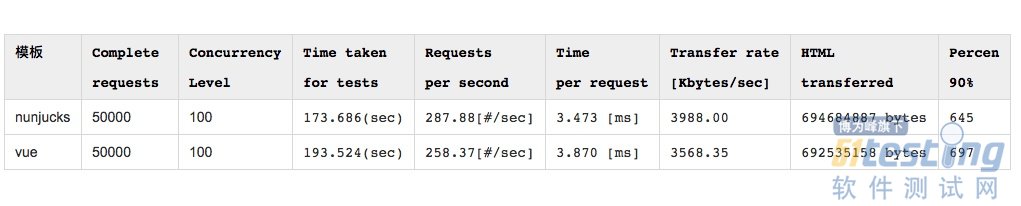
从上图 ab 对比数据可以得出以下结论:
●HTML transferred 内容传输量数据非常接近,保证了对比测试的客观性。
●50000个请求,vue 整体处理时间比 nunjucks 慢 20s, 平均每个相当于慢 0.4 ms,这个于 上面 render 数据对比是吻合的。
●nunjucks 每秒处理的请求数比 vue 略微多 30 个, 用户平均请求等待时间少 0.4 ms
●从 percentage time 时间我们发现 nunjucks 和 vue 每个区间都是非常接近。
总体上,nunjucks 和 vue 在 模板渲染,CPU使用,内存占用没有很明显的差异,各指标基本接近。 其中 nunjucks 在模板渲染方面略微快一点点(个位数毫秒级), 内存占用方面 vue 比 nunjucks 占用略微多一点,但都在可接受范围内。
CPU和内存工具
在进行 CPU 和 内存 监控统计分析时,也没有找到简单好用的火焰图工具。Alinode 平台统计粒度太大,数据也不是时时可以拿到,也不好使。找到一些成熟的工具比如 perf 和 FlameGraph 都比较复杂,而且一些资料都是 linux 上面的, 配置相当繁琐,只好放弃。另外找到 Mac 的一个小工具 iStat Menus 能显示电脑磁盘CPU,内存等占用情况不错,图也很小且不适合做具体分析,作为电脑监控工具还不错。最终也没有找到合适简单工具,只好简单撸一个,顺便玩了一把 http://socket.io 和图表工具。上面 CPU 和 内存 统计是通过 Egg egg-socket.io 和 egg-schedule 插件, current-processes, socket.io.js 以及图片库 Ignite UI 实现的。
●Egg Node端 egg-socket.io和egg-schedule current-processes 结合
'use strict'; const ps = require('current-processes'); const os = require('os'); const totalMem = os.totalmem(); // bytes to MB module.exports = app => { exports.schedule = { interval: '3s', type: 'worker' }; exports.task = function* (ctx) { ps.get((err, processes) => { const proArr = processes.filter(pro => { return pro.name === 'node'; }).sort((a, b) => { return a.pid - b.pid; }); proArr.shift(); proArr.shift(); const cpu_mem_info = proArr.map(pro => { return { pid: pro.pid, cpuPercent: pro.cpu, totalMemory: totalMem, usedMemory: pro.mem.private, // RSS实际内存占用大小 memoryPercent: pro.mem.usage * 100, // 进程占用内存百分比 virtualMemory: pro.mem.virtual, // 虚拟内存占用大小 }; }); ctx.app.io.emit('monitor-memory-cpu', cpu_mem_info); }); }; return exports; }; |
●客户端实现 socket 监听 monitor-memory-cpu 事件, 每 3s 中获取到一次 Node 数据,然后绘制图表。 图片绘制请参考例子: https://www.igniteui.com/spline-charts/spline-area
var socket = io.connect("http://localhost:7001"); socket.on("monitor-memory-cpu", function (data) { data.forEach(info => { info.displayCPU = info.cpuPercent; info.displayMem = info.usedMemory; info.displayTime = new Date().toLocaleTimeString(); cpuData.push(info); $("#cpuChart").igDataChart("notifyInsertItem", cpuData, cpuData.length - 1, info); $("#memoryChart").igDataChart("notifyInsertItem", cpuData, cpuData.length - 1, info); }); }); |