

Golang为我们提供了非常方便的性能测试工具pprof,使用pprof可以非常方便地对Go程序的运行效率进行监测。本文讲述如何使用pprof对Go程序进行性能测试,并使用qcachegrind查看性能测试的输出文件。
载入pprof模块
想要对一个Go程序进行pprof监测,第一步是在main函数所在的模块中添加 net/http/pprof 模块。import后面的“_”是一定要加上的。
import _ "net/http/pprof"
运行HTTP服务器
如果你的程序不是一个Web服务器,那么你还需要再程序中启动一个Http服务器,如下所示:
go func() { http.ListenAndServe("localhost:13001", nil) }() |
重新编译并运行程序。然后我们可以通过网页浏览器查看当前程序的运行状态:http://localhost:13001/debug/pprof 。如果运行正常,可以看到类似如下的输出:
/debug/pprof/ profiles: 0 block 9 goroutine 7 heap 0 mutex 12 threadcreate full goroutine stack dump |
在这个网页里我们可以查看程序当前的goroutine运行状态、内存使用情况等信息。
使用go tool pprof命令
打开命令行,输入命令: go tool pprof http://localhost:13001/debug/pprof/profile ,此时命令行会卡出,并打印类似如下信息:
C:\Users\Administrator>go tool pprof http://localhost:13001/debug/pprof/profile Fetching profile from http://localhost:13001/debug/pprof/profile Please wait... (30s)<br>Saved profile in \pprof\pprof.localhost:13001.samples.cpu.007.pb.gz<br>Entering interactive mode (type "help" for commands) |
在经过30秒的等待之后,性能测试完成,会在本地保存压测结果。
可以使用top命令查看开销最大的一些函数,或者使用web命令直接在网页中查看,其他的命令还包括:svg,pdf,png等,你可以选择自己所习惯的工具查看性能检测结果。
(pprof) top20 970ms of 1130ms total (85.84%) Showing top 20 nodes out of 86 (cum >= 20ms) flat flat% sum% cum cum% 280ms 24.78% 24.78% 300ms 26.55% runtime.stdcall1 100ms 8.85% 33.63% 110ms 9.73% runtime.acquirep 100ms 8.85% 42.48% 100ms 8.85% runtime.siftdownTimer 90ms 7.96% 50.44% 90ms 7.96% runtime.osyield 80ms 7.08% 57.52% 260ms 23.01% runtime.timerproc 60ms 5.31% 62.83% 60ms 5.31% runtime.memeqbody 50ms 4.42% 67.26% 50ms 4.42% runtime.casgstatus 30ms 2.65% 69.91% 30ms 2.65% runtime.cgocall 30ms 2.65% 72.57% 430ms 38.05% runtime.exitsyscallfast_pidle 20ms 1.77% 74.34% 20ms 1.77% runtime.asmstdcall 20ms 1.77% 76.11% 20ms 1.77% runtime.goready 20ms 1.77% 77.88% 20ms 1.77% runtime.pidleget 20ms 1.77% 79.65% 60ms 5.31% runtime.startm 10ms 0.88% 80.53% 20ms 1.77% github.com/xiaonanln/goworld/netutil.(*PacketConnection).Flush 10ms 0.88% 81.42% 10ms 0.88% github.com/xiaonanln/goworld/netutil.allocPacket 10ms 0.88% 82.30% 80ms 7.08% main.(*DispatcherService).getEntityDispatcherInfoForRead 10ms 0.88% 83.19% 10ms 0.88% net.(*fdMutex).rwunlock 10ms 0.88% 84.07% 10ms 0.88% runtime.(*guintptr).cas 10ms 0.88% 84.96% 10ms 0.88% runtime.acquirep1 10ms 0.88% 85.84% 20ms 1.77% runtime.asmcgocall |
值得一提的是,如果我们的程序中一台Linux服务器上运行,我们也可以在自己的Windows电脑上运行go tool pprof命令,只需要将网址里的localhost替换为Linux服务器的地址即可。
使用qcachegrind查看性能监测结果
相比top、web、svg等命令,查看性能检测结果最方便的工具还是qcachegrind。首先需要前往 https://sourceforge.net/projects/qcachegrindwin/files/ 下载Windows版的qcachegrind。
在go tool pprof的命令行里,使用callgrind命令生成qcachegrind工具所支持的文件类型:
(pprof) callgrind
Generating report in profile010.callgraph.out
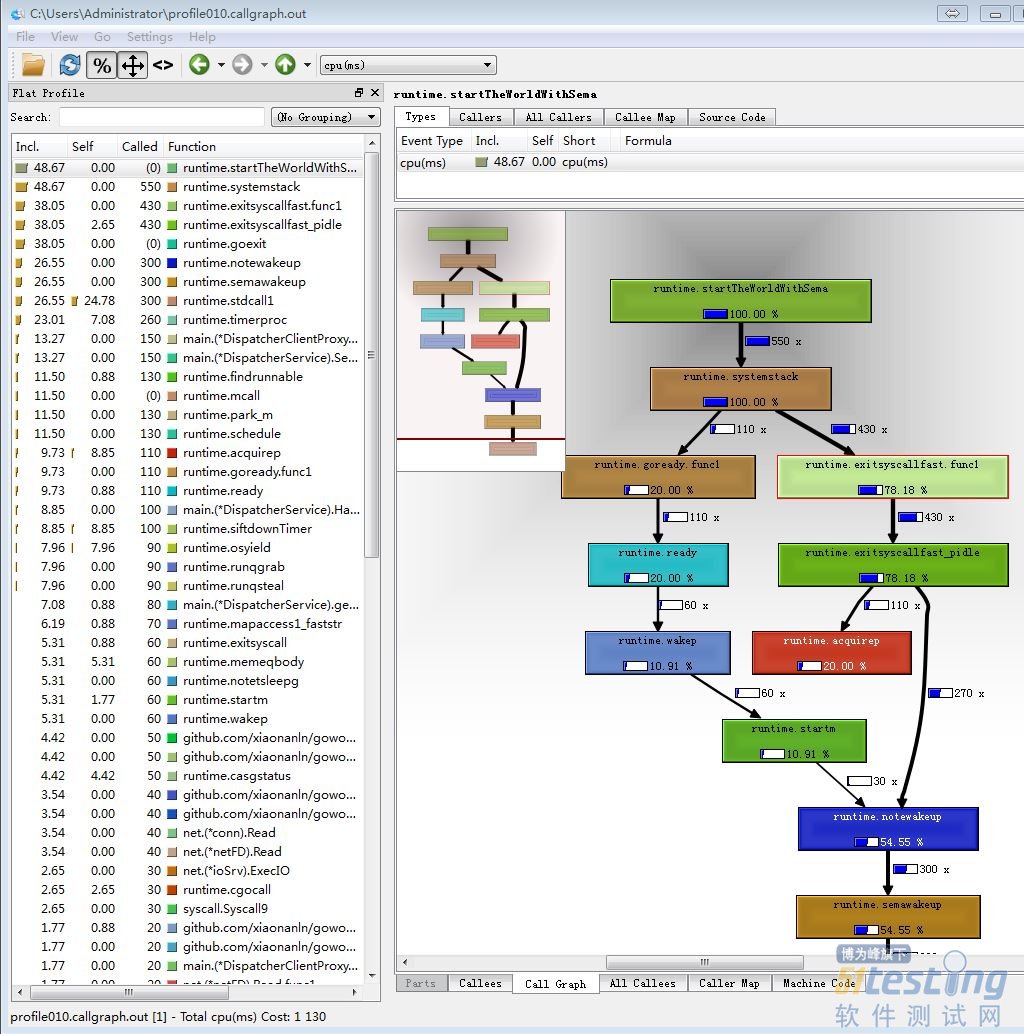
然后使用下载的qcachegrind.exe打开生成的文件即可,此处为:profile010.callgraph.out。使用qcachegrind可以在各个函数之间自由跳转,查看函数内部的CPU占用情况,相对其他格式要更加灵活方便。例如以下是我们对GoWorld游戏服务器进行一次性能测试的结果。
不成熟的优化是万恶之源!因此我们在对自己的Go程序进行优化之前,不妨先使用go tool pprof对程序性能进行检测,然后对关键的性能瓶颈部分进行优化,这样才会起到事半功倍的效果。Golang提供的pprof是进行性能测试的利器,经过我们的实际使用发现,即使在开启性能测试的30s里,pprof对程序带来的性能损耗并不大。


