#!/usr/bin/env python
# -*- coding: UTF-8 -*-
# _ooOoo_
# o8888888o
# 88" . "88
# ( | - _ - | )
# O\ = /O
# ____/`---'\____
# .' \\| |// `.
# / \\|||:|||// \
# / _|||||-:- |||||- \
# | | \\\ - /// | |
# | \_| ''\---/'' | _/ |
# \ .-\__ `-` ___/-. /
# ___`. .' /--.--\ `. . __
# ."" '< `.___\_<|>_/___.' >'"".
# | | : `- \`.;`\ _ /`;.`/ - ` : | |
# \ \ `-. \_ __\ /__ _/ .-` / /
# ==`-.____`-.___\_____/___.-`____.-'==
# `=---='
'''
@Project :pythonalgorithms
@File :Activationfunction.py
@Author :不胜人生一场醉@Date :2021/8/11 0:14
'''
import numpy as np
from matplotlib import pyplot as plt
def drawpic(x, y, label=' ', title=' '):
plt.figure(figsize=(10, 8))
ax = plt.gca() # 通过gca:get current axis得到当前轴
plt.rcParams['font.sans-serif'] = ['SimHei'] # 绘图中文
plt.rcParams['axes.unicode_minus'] = False # 绘图负号
plt.plot(x, y, label=label)
# 设置图片的右边框和上边框为不显示
ax.spines['right'].set_color('none')
ax.spines['top'].set_color('none')
# 挪动x,y轴的位置,也就是图片下边框和左边框的位置
# data表示通过值来设置x轴的位置,将x轴绑定在y=0的位置
ax.spines['bottom'].set_position(('data', 0))
# axes表示以百分比的形式设置轴的位置,即将y轴绑定在x轴50%的位置
ax.spines['left'].set_position(('axes', 0.5))
# ax.spines['left'].set_position(('data', 0))
plt.title(title)
plt.legend(loc='upper right')
plt.show()
if __name__ == '__main__':
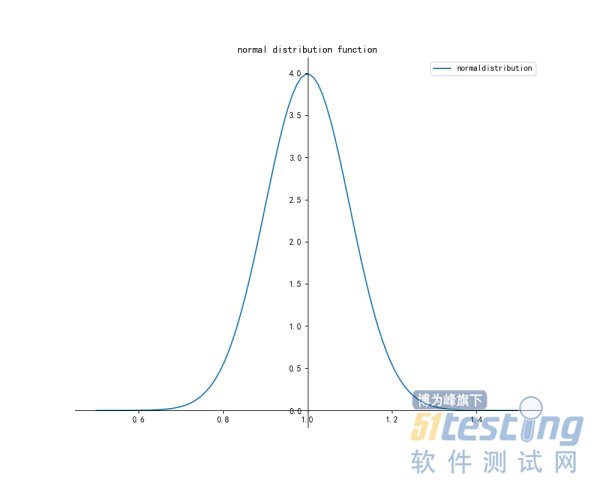
std = 0.1 # 标准差为0.1
avg = 1 # 平均值为1
x = np.linspace(avg - 5 * std, avg + 5 * std, 100)
y = normaldistribution(x, avg, std)
drawpic(x, y, 'normaldistribution', 'normal distribution function')
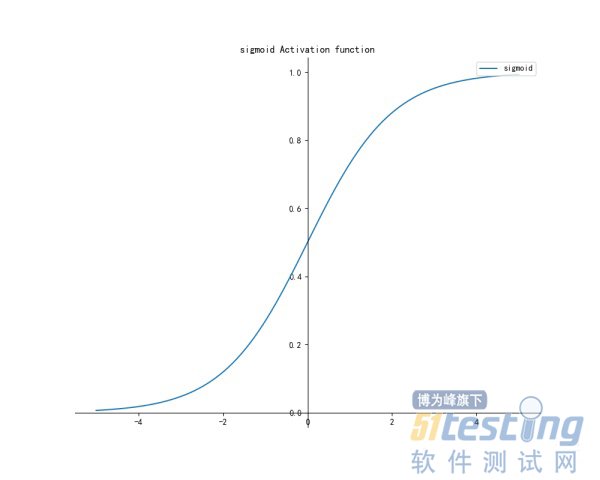
x = np.linspace(-5, 5, 100)
y = sigmoid(x)
drawpic(x, y, 'sigmoid', 'sigmoid Activation function')
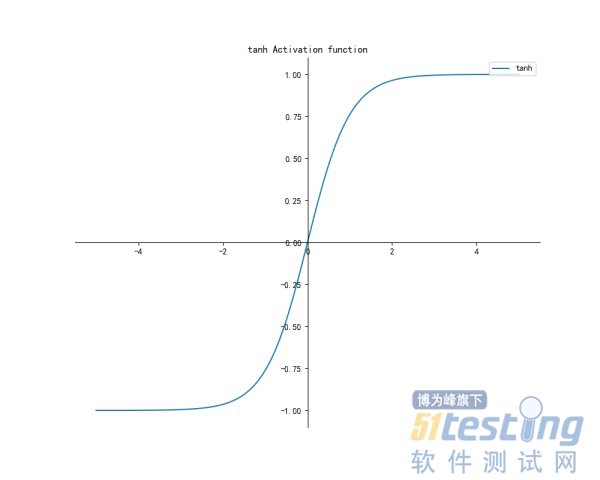
y = tanh(x)
drawpic(x, y, 'tanh', 'tanh Activation function')
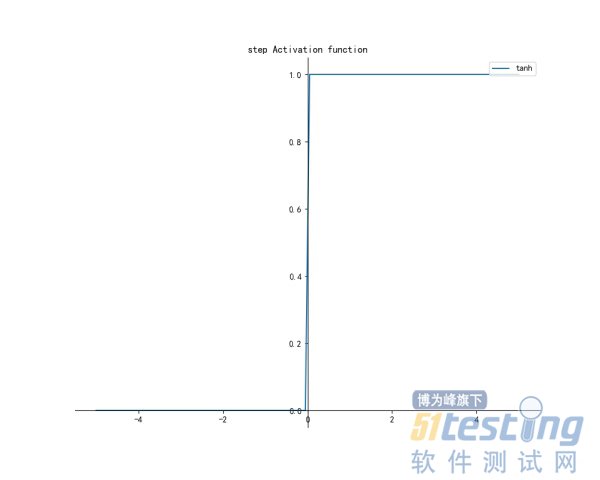
y = stepfunction(x)
drawpic(x, y, 'tanh', 'step Activation function')
y = relu(x)
drawpic(x, y, 'relu', 'relu Activation function')
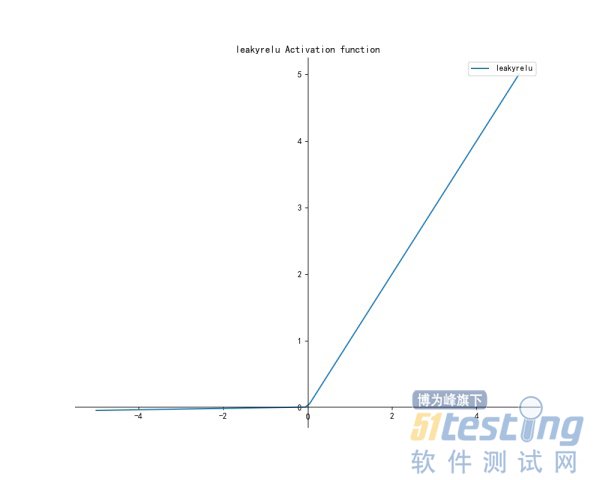
y = leakyrelu(x)
drawpic(x, y, 'leakyrelu', 'leakyrelu Activation function')
y = softmax(x)
drawpic(x, y, 'softmax', 'softmax Activation function')